-
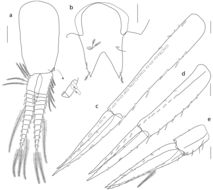
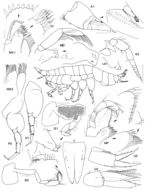
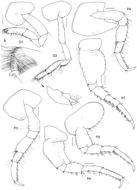
Figure 16.Oedicerina loerzae sp. n., male holotype, 8.5 mm; southwest Pacific Ocean, NIWA 84727, TAN 0705-41. a) pleopod 1; b) telson; c) uropod 1; d) uropod 2; e) uropod 3. Scale bars: a; 200 µm; b–e; 100 µm.
-
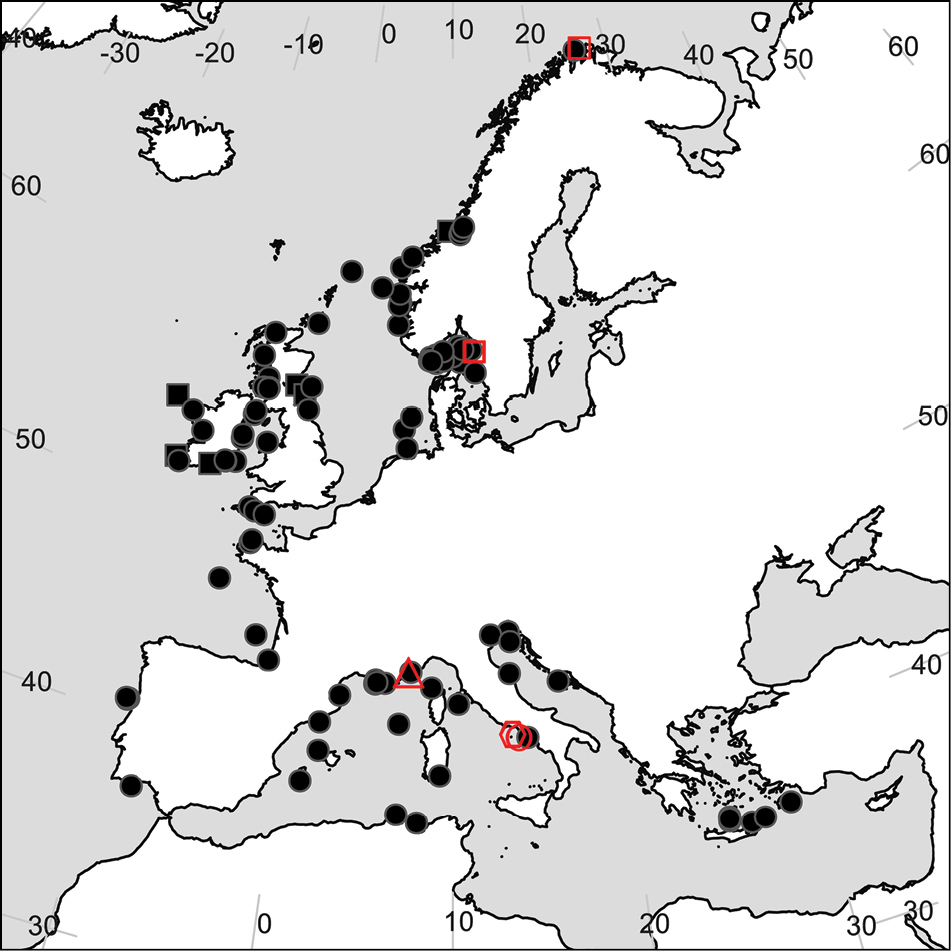
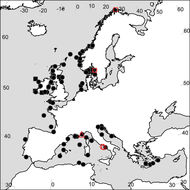
Figure 10.European distribution of Scopelocheirus hopei (Costa, 1851) (African distribution excluded). Circles represent records of Scopelocheirus hopei and its objective synonyms. Subjective synonyms are represented by the following symbols: (■) Anonyx Kröyeri Bruzelius, 1859; (▲) Callisoma Branickii Wrzesniowski, 1874; (●) Callisoma Barthelemyi Costa, 1853. Type localities are indicated by the corresponding open symbol.
-
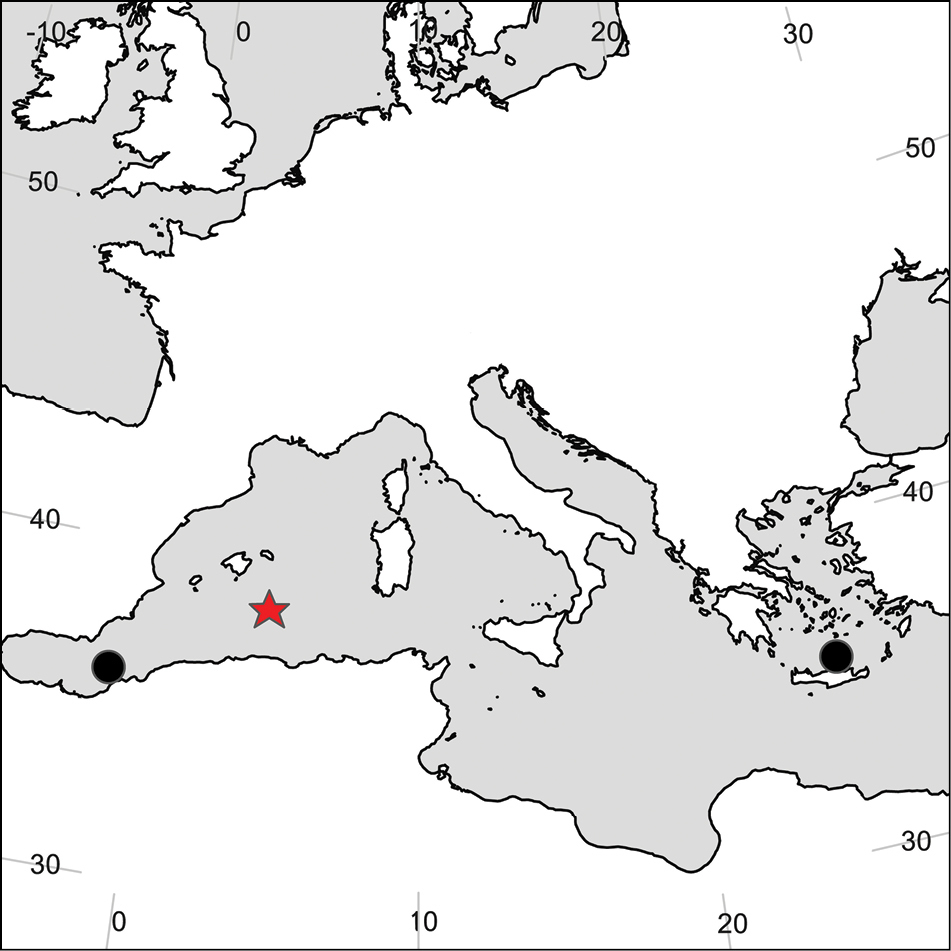
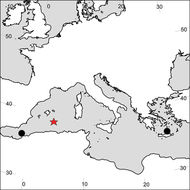
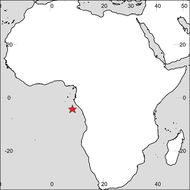
Figure 11.Distribution of Scopelocheirus polymedus Bellan-Santini, 1984. Star indicates type locality.
-
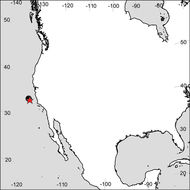
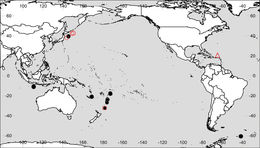
Figure 12.Distribution of Anisocallisoma armigera Hendrycks & Conlan, 2003. Star indicates type locality.
-
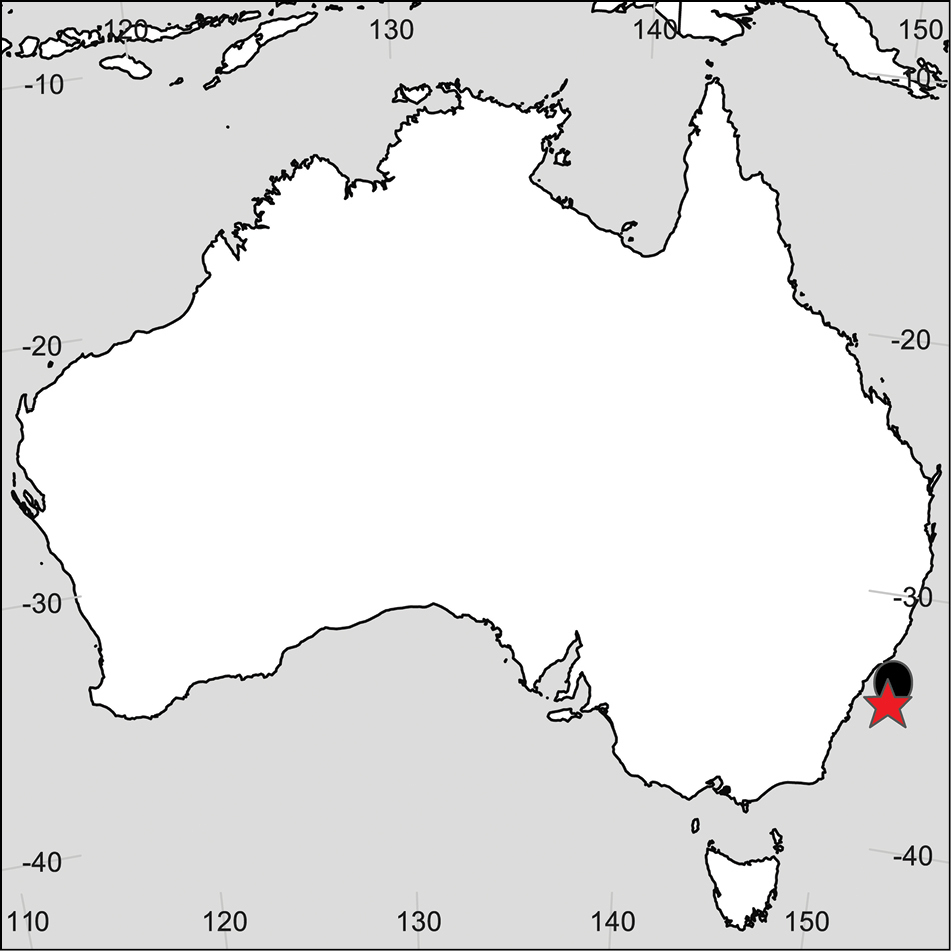
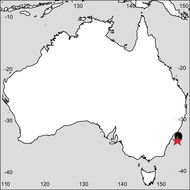
Figure 13.Distribution of Austrocallisoma jerryi sp. n. Star indicates type locality.
-
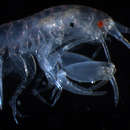
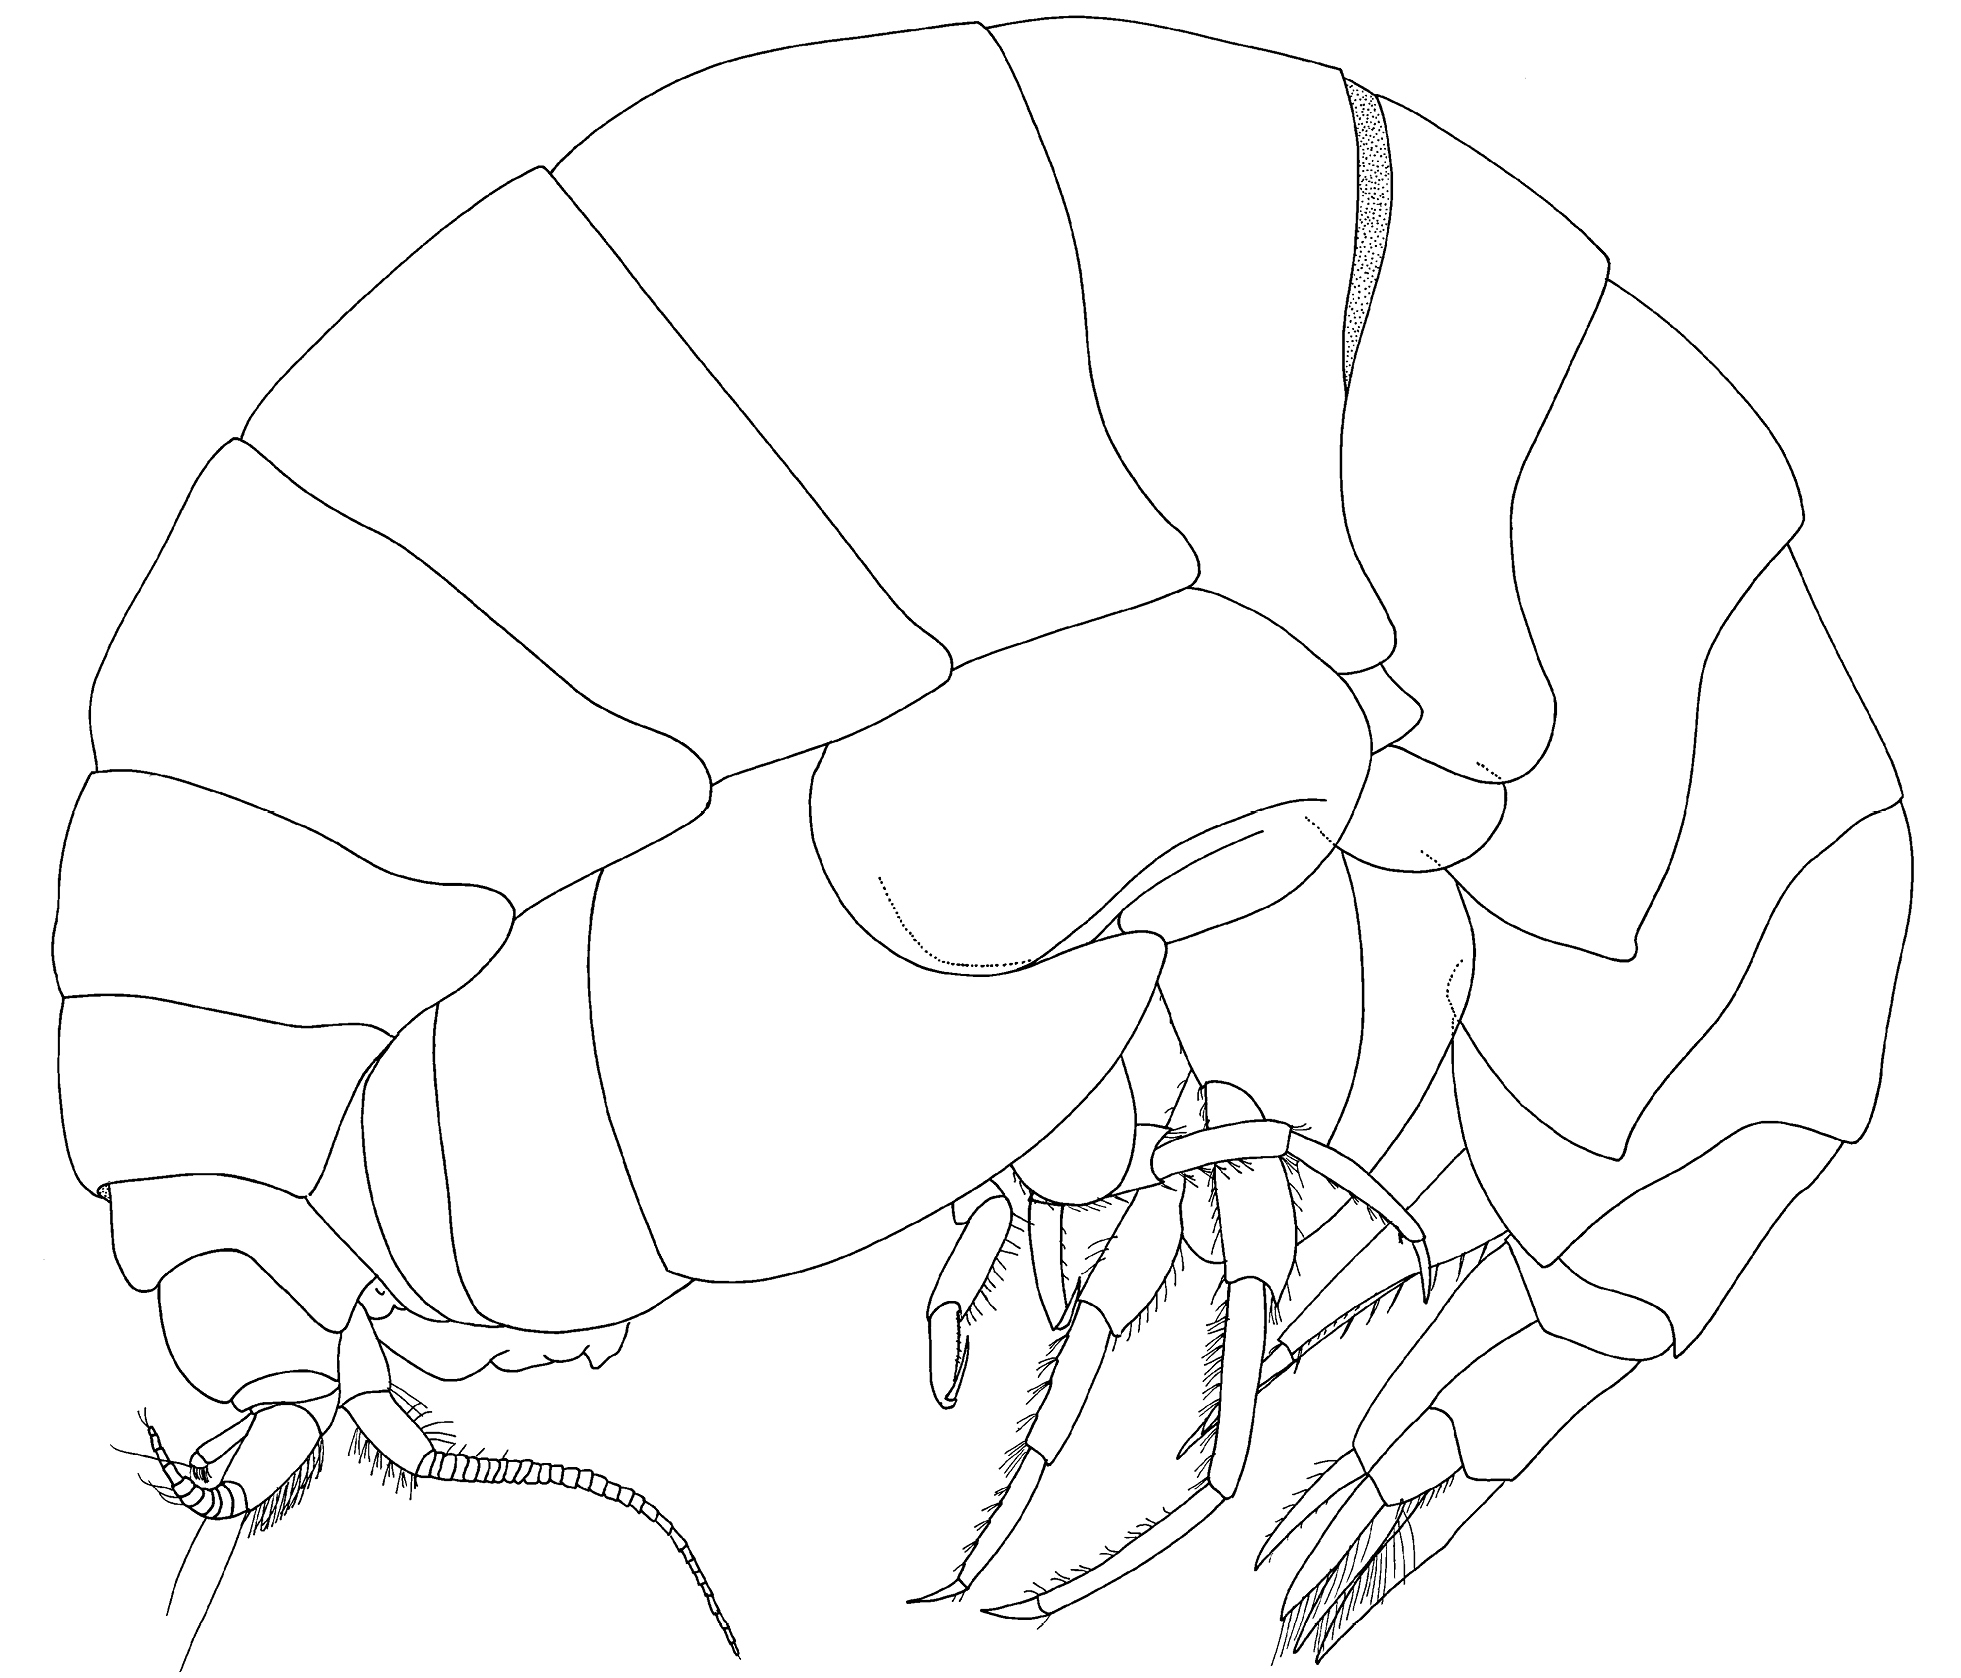
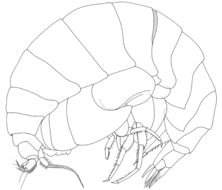
Figure 14.Austrocallisoma jerryi sp. n., holotype, female, 32.0 mm, AM P.69087, from east of Sydney, New South Wales, Australia.
-
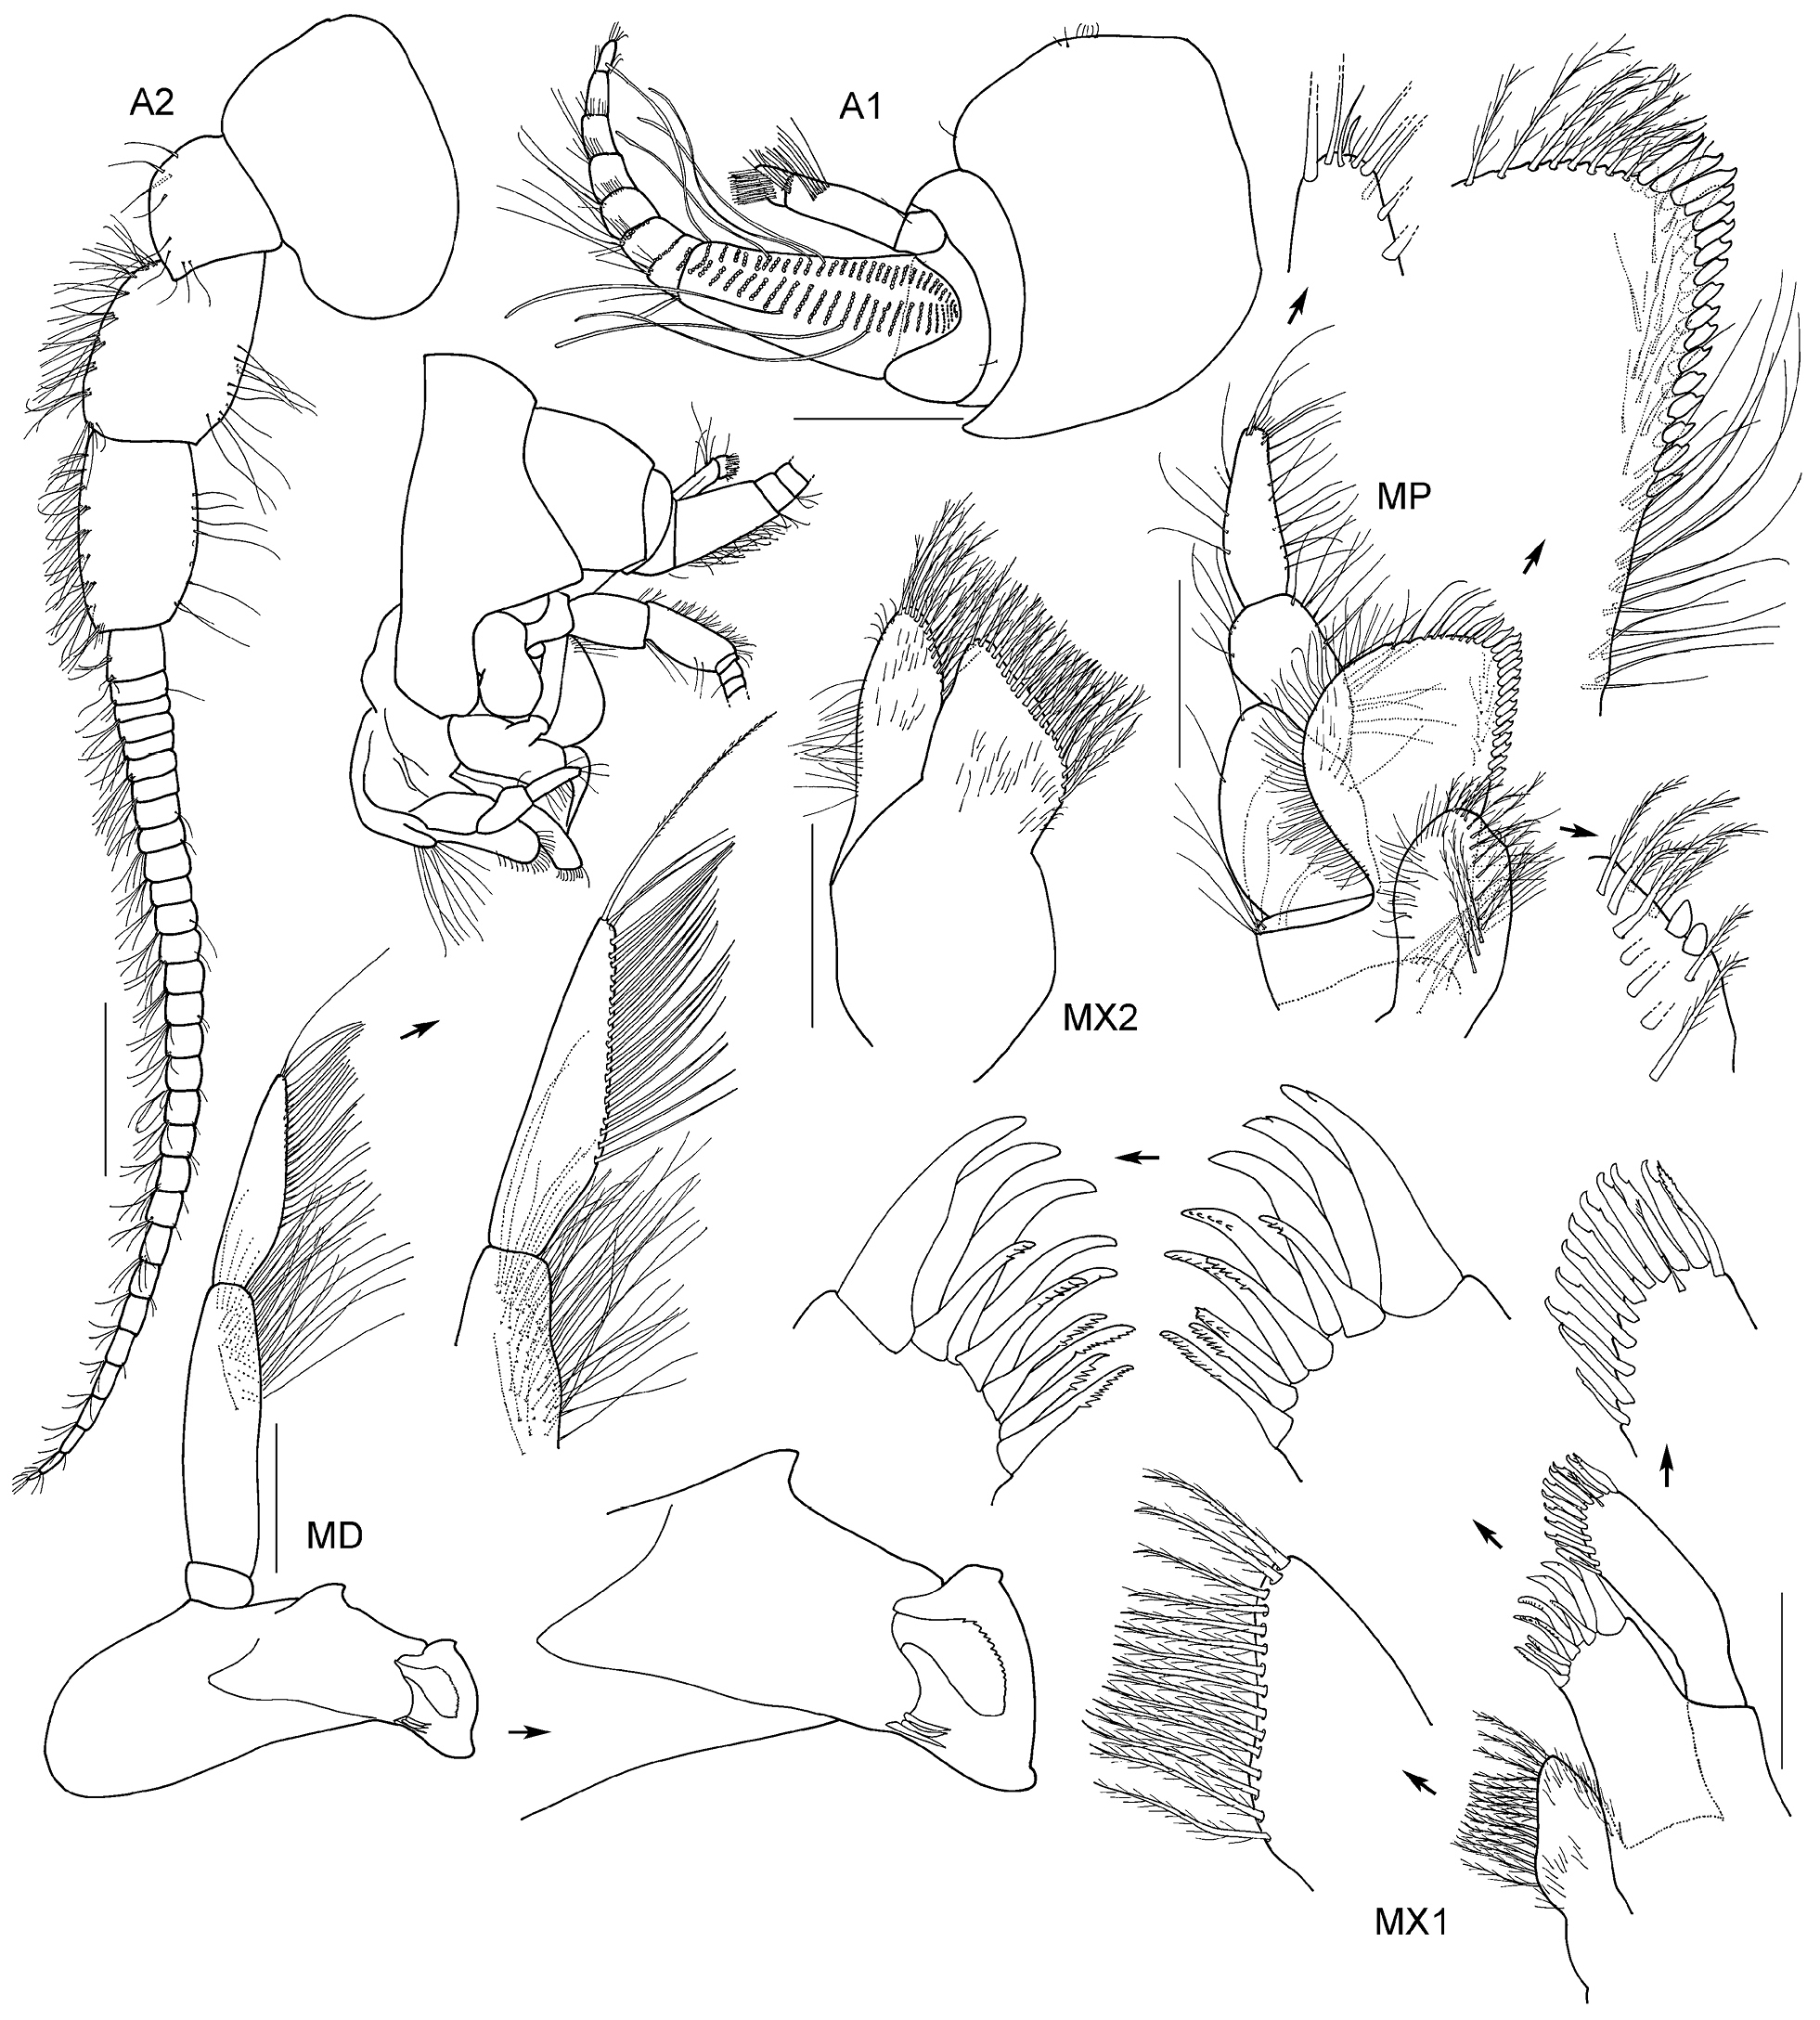
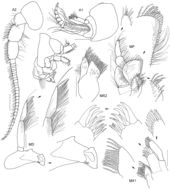
Figure 15.Austrocallisoma jerryi sp. n., holotype, female, 32.0 mm, AM P.69087, from east of Sydney, New South Wales, Australia. Scales represent 0.5 mm.
-
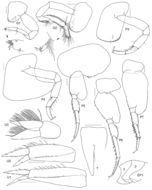
Figure 16.Austrocallisoma jerryi sp. n., holotype, female, 32.0 mm, AM P.69087, from east of Sydney, New South Wales, Australia. Scales represent 0.5 mm.
-
Figure 17.Distribution of Bathycallisoma schellenbergi (Birstein & Vinogradov, 1958) and its synonyms. Circles represent Bathycallisoma schellenbergi and its objective synonyms. Subjective synonyms are represented by the following symbols: (■) Bathycallisoma pacifica, (▲) aff. Paracallisoma spec. Type localities are represented by the corresponding open symbol.
-
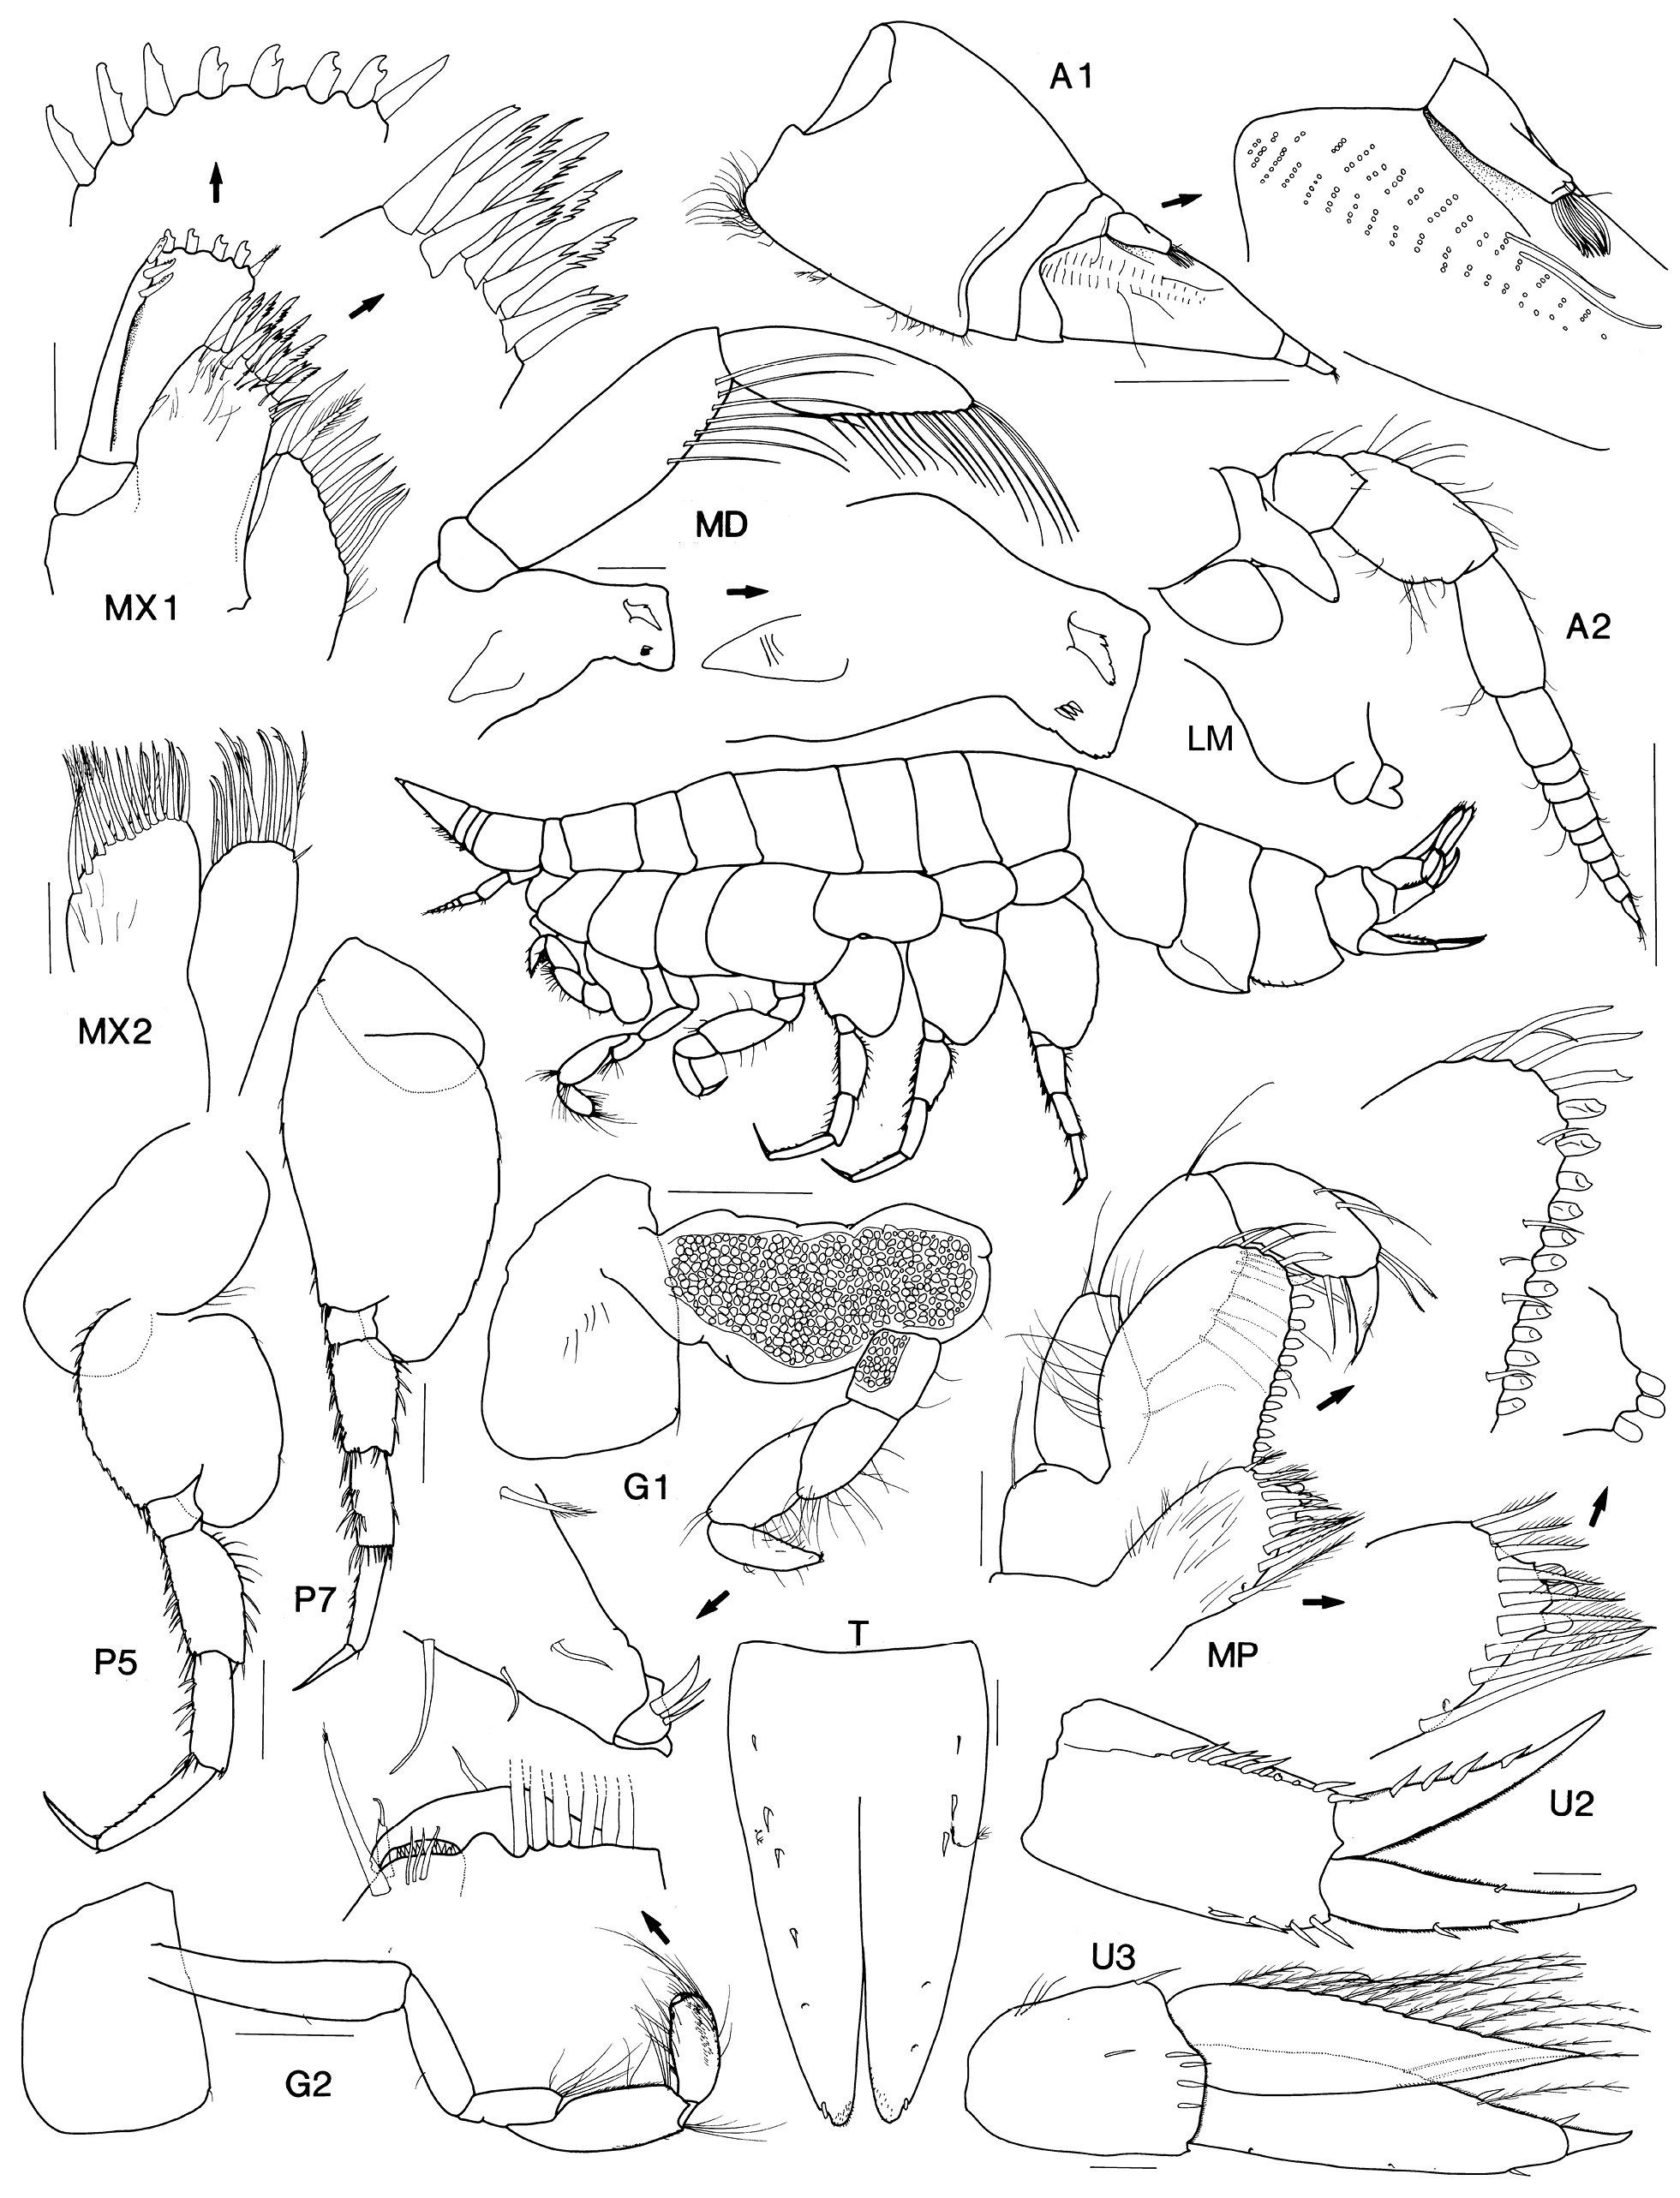
Figure 18.Bathycallisoma pacifica Dahl, 1959. Holotype female, 33 mm, ZMUC CRU-7674, Kermadec Trench. Scales for gnathopods, pereopods represent 1.0 mm; remainder represent 0.5 mm.
-
Figure 19.Distribution of Eucallisoma glandulosa J.L. Barnard, 1961.
-
Figure 20.Eucallisoma glandulosa J.L. Barnard. Holotype, ?male, 10 mm, ZMUC CRU-1720, off Gabon, east Atlantic Ocean. Scales for antennae, gnathopods, pereopods represent 0.5 mm; remainder represent 0.1 mm.
-
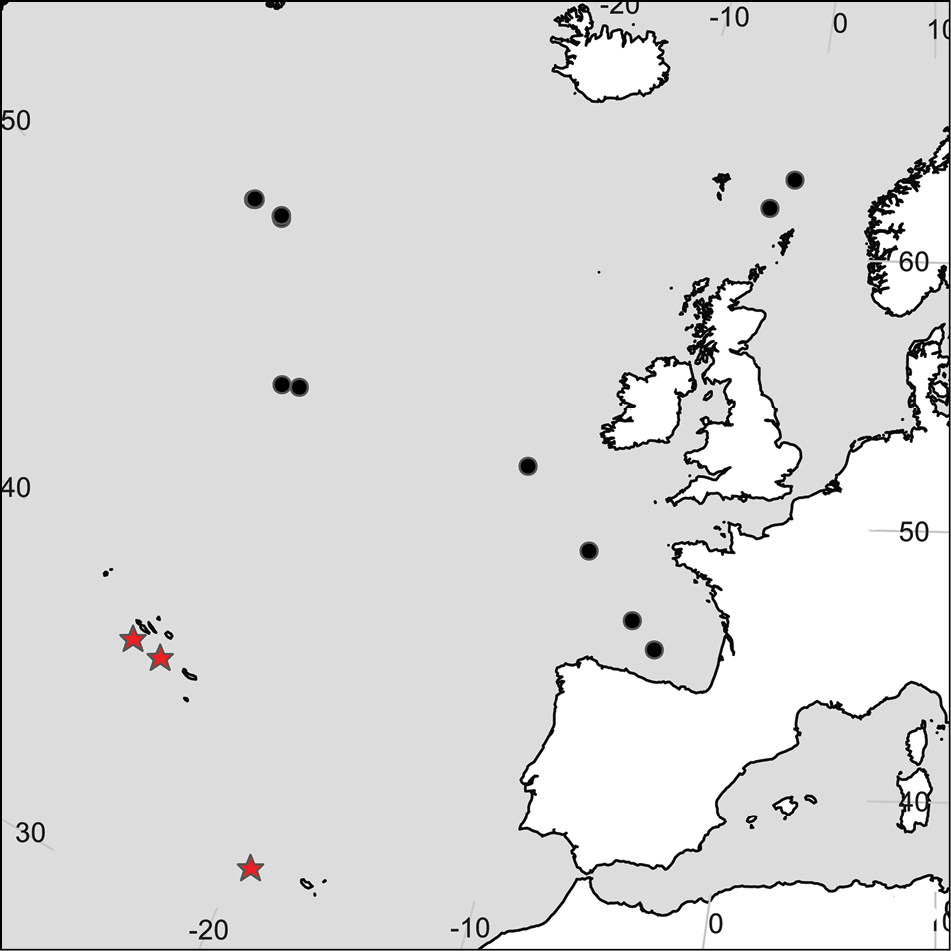
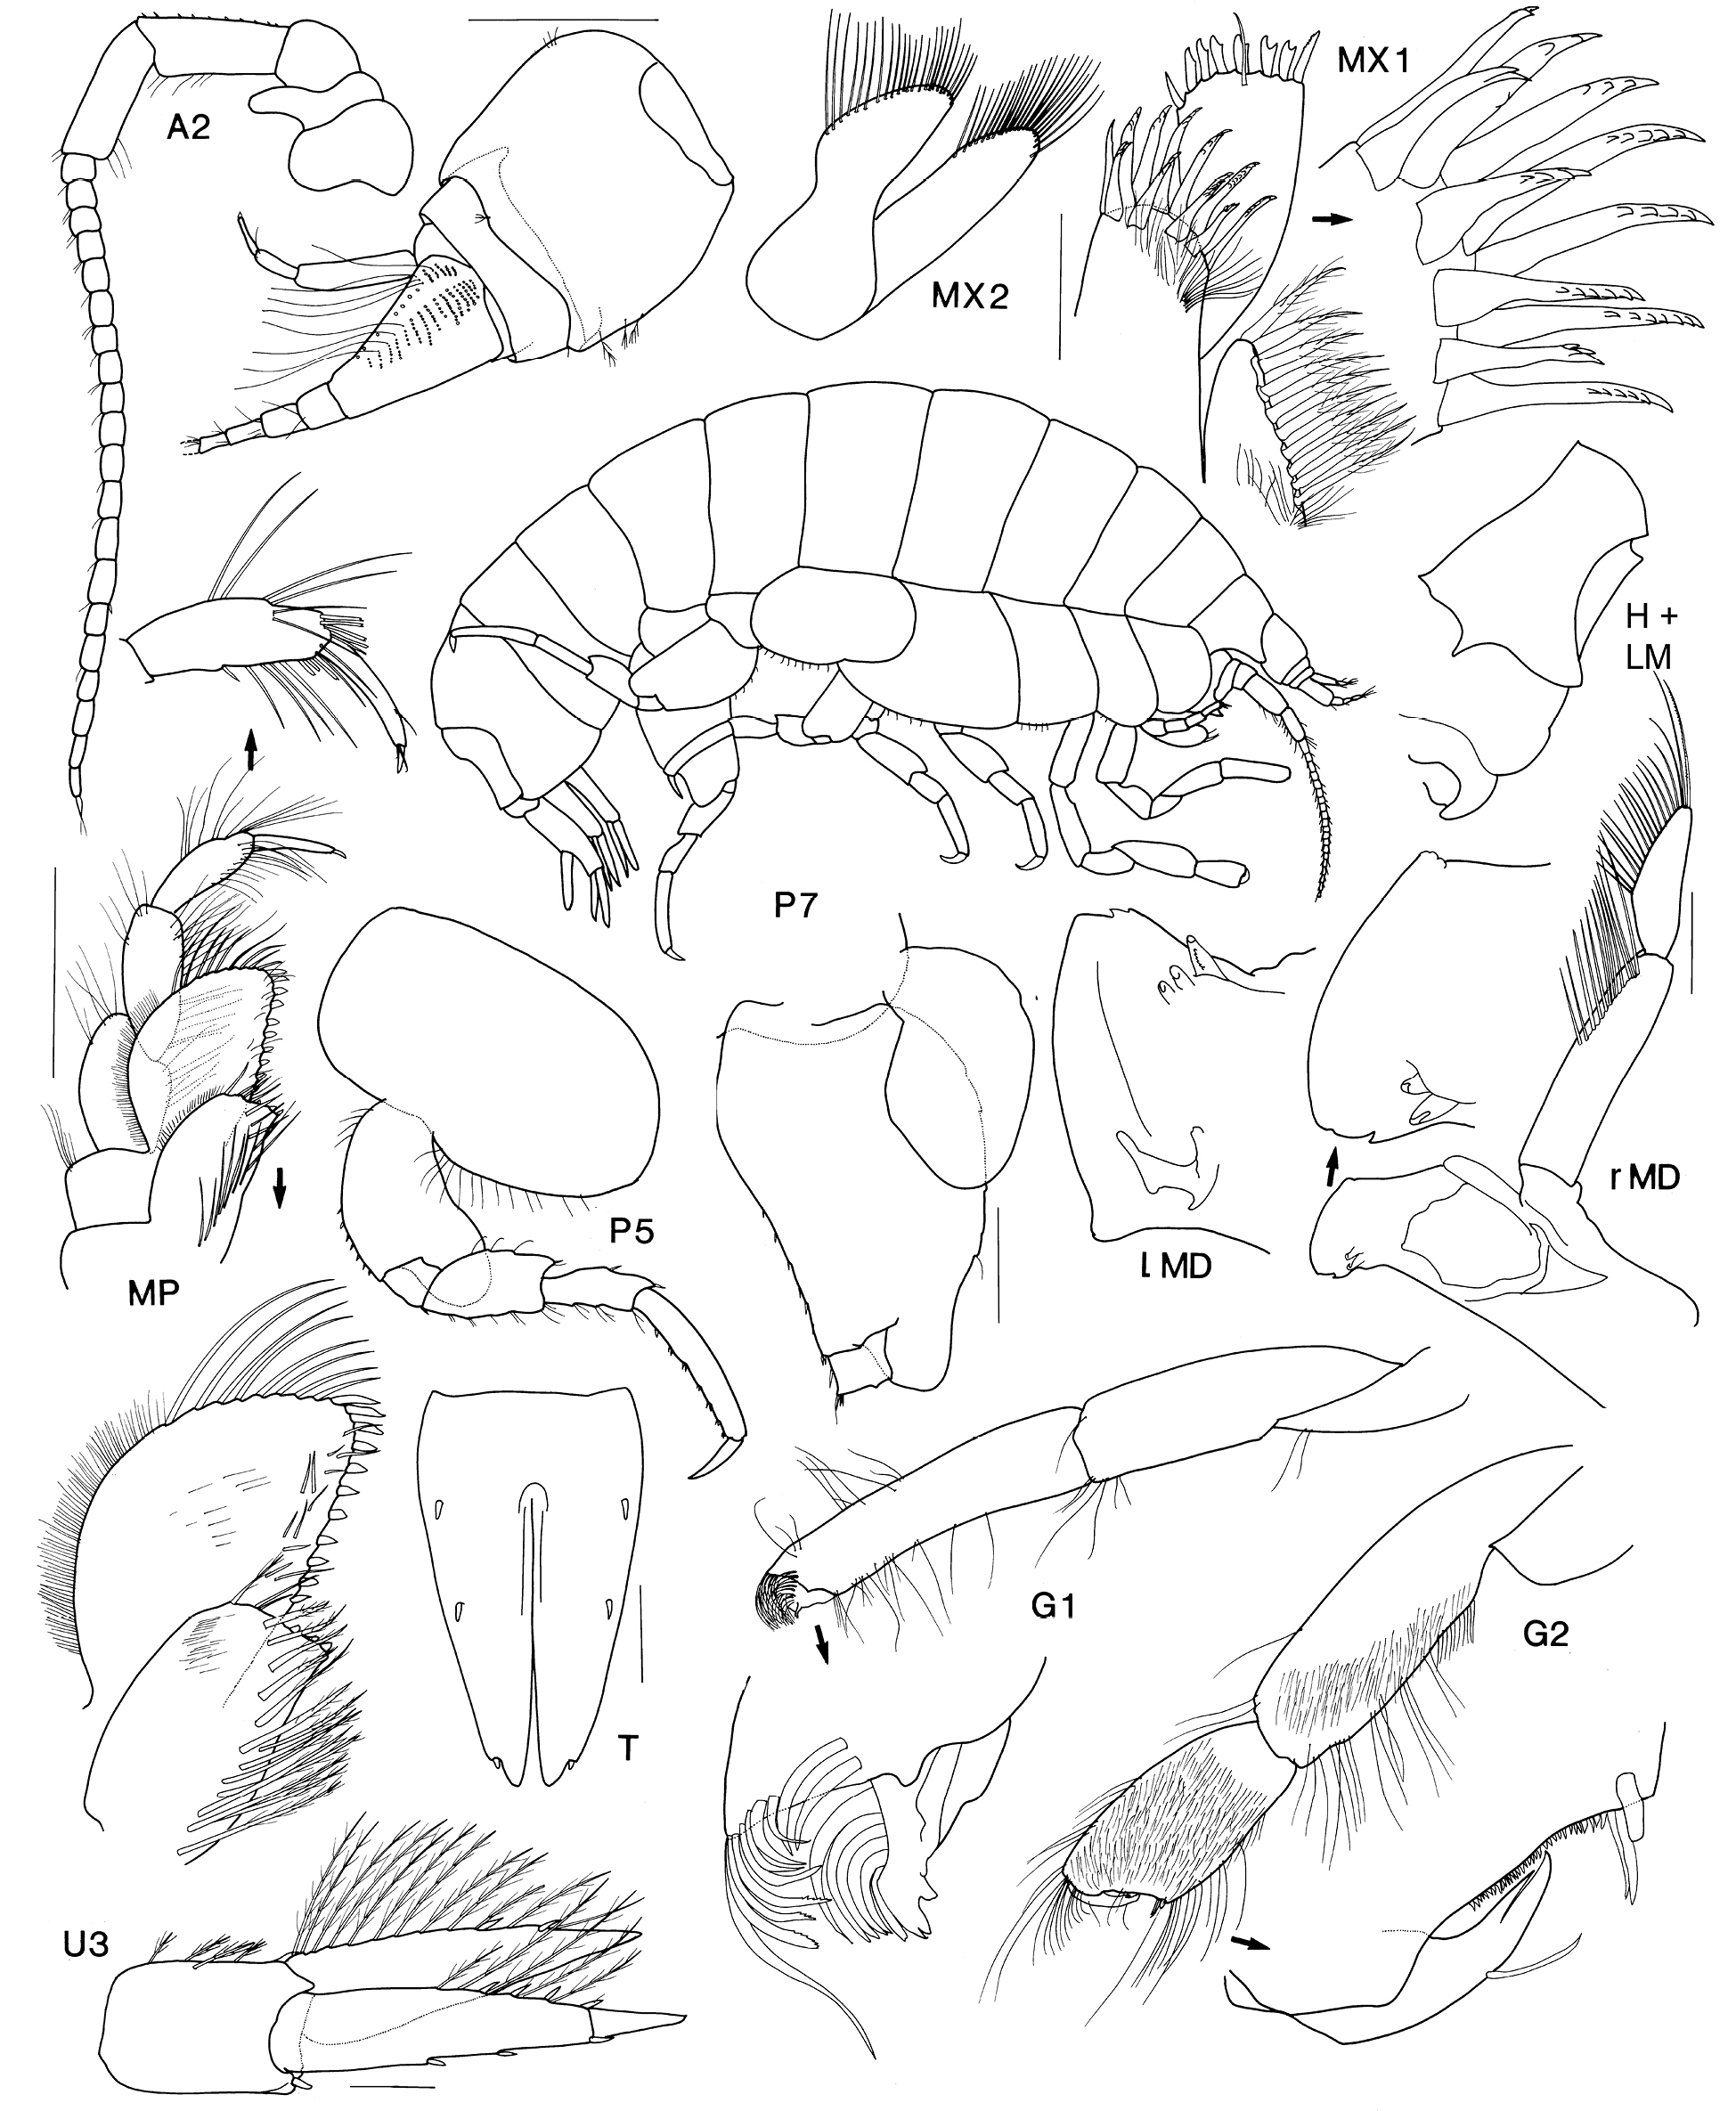
Figure 22.Distribution of Paracallisoma alberti Chevreux, 1903. Star indicates type locality.
-
Figure 23.Paracallisoma alberti Chevreux, 1903. Syntype female, MOM, near Madeira, North Atlantic Ocean. Whole animal after Chevreux 1903; A2, MX2, P5 after Chevreux 1935. Scales for MD, MX1, U3, T represent 0.2 m; remainder represent 0.5 mm.
-
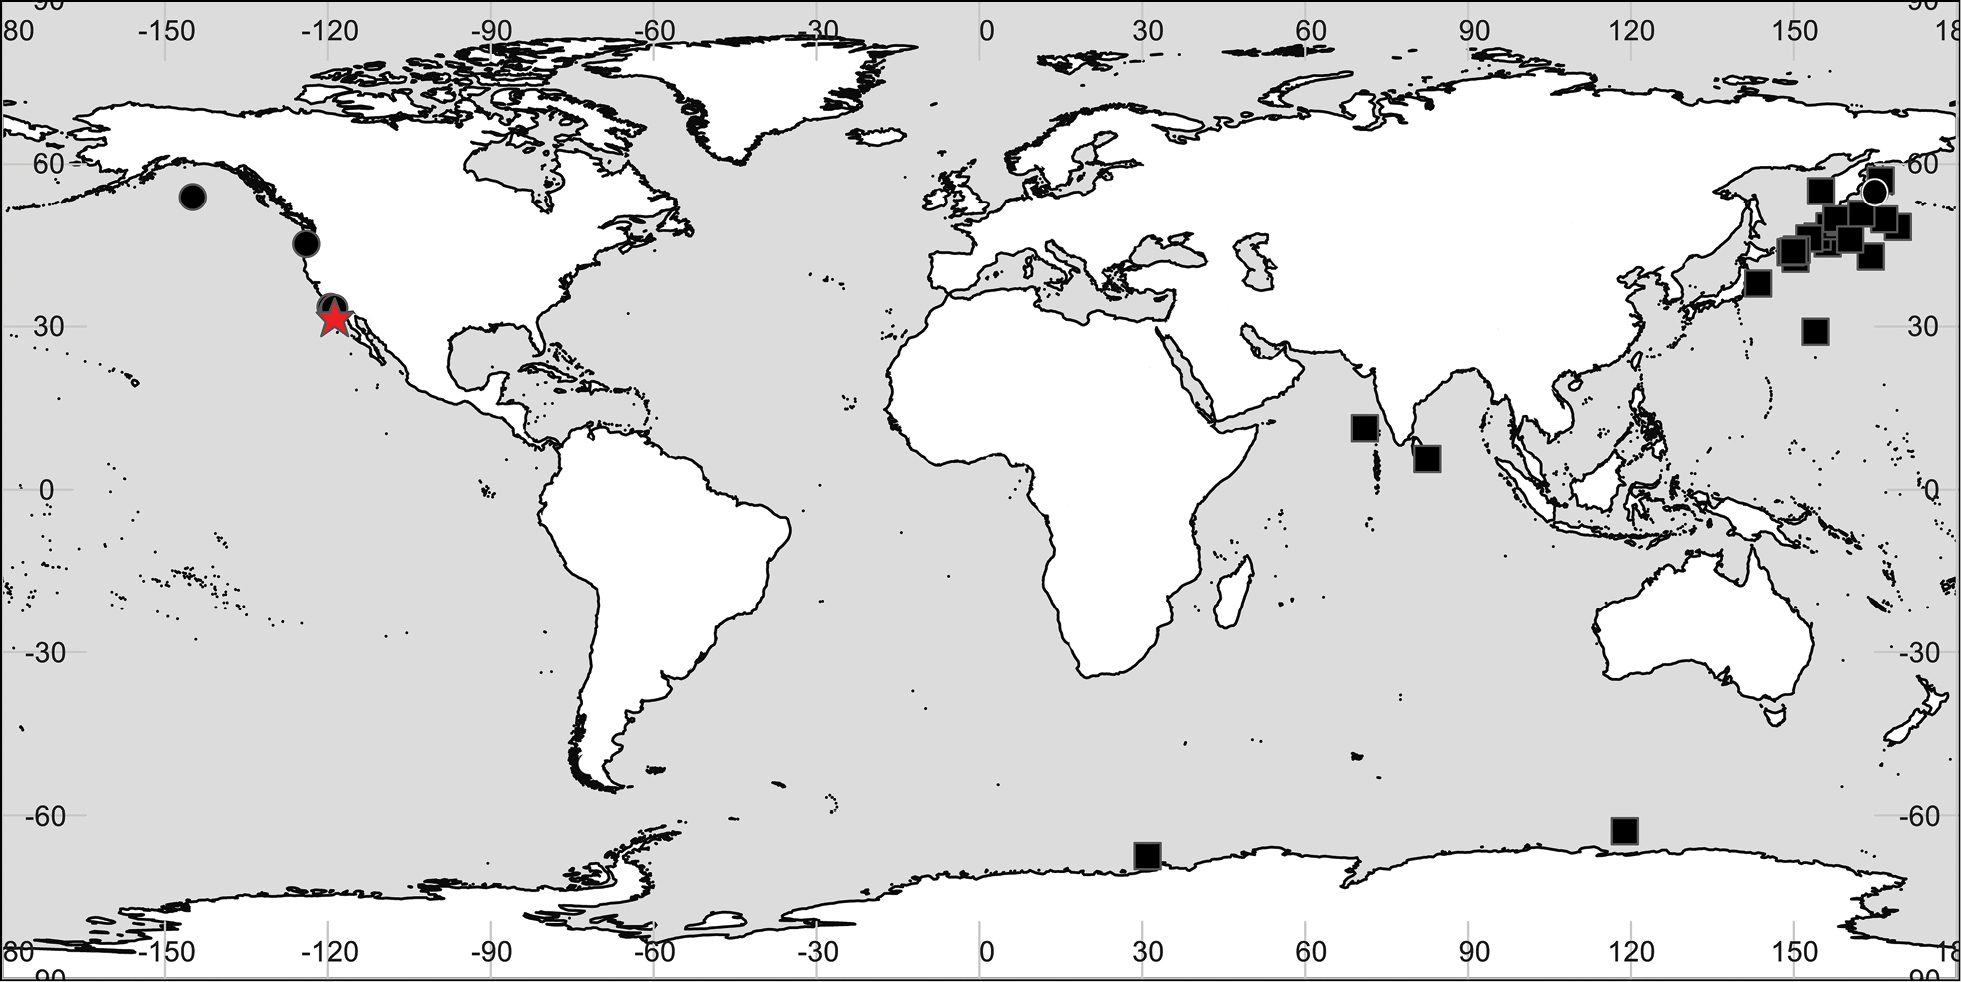
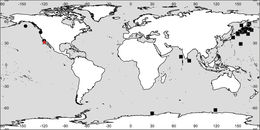
Figure 24.Distribution of Paracallisoma coecum (Holmes, 1908). Circles (●) represent records of Paracallisoma coecum; squares (■) represent misidentifications of Paracallisoma alberti that may represent Paracallisoma coecum or another species. Star indicates type locality.
-
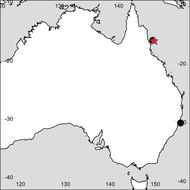
Figure 31.Distribution of Paracallisoma zivianii sp. n. Star indicates type locality.
-
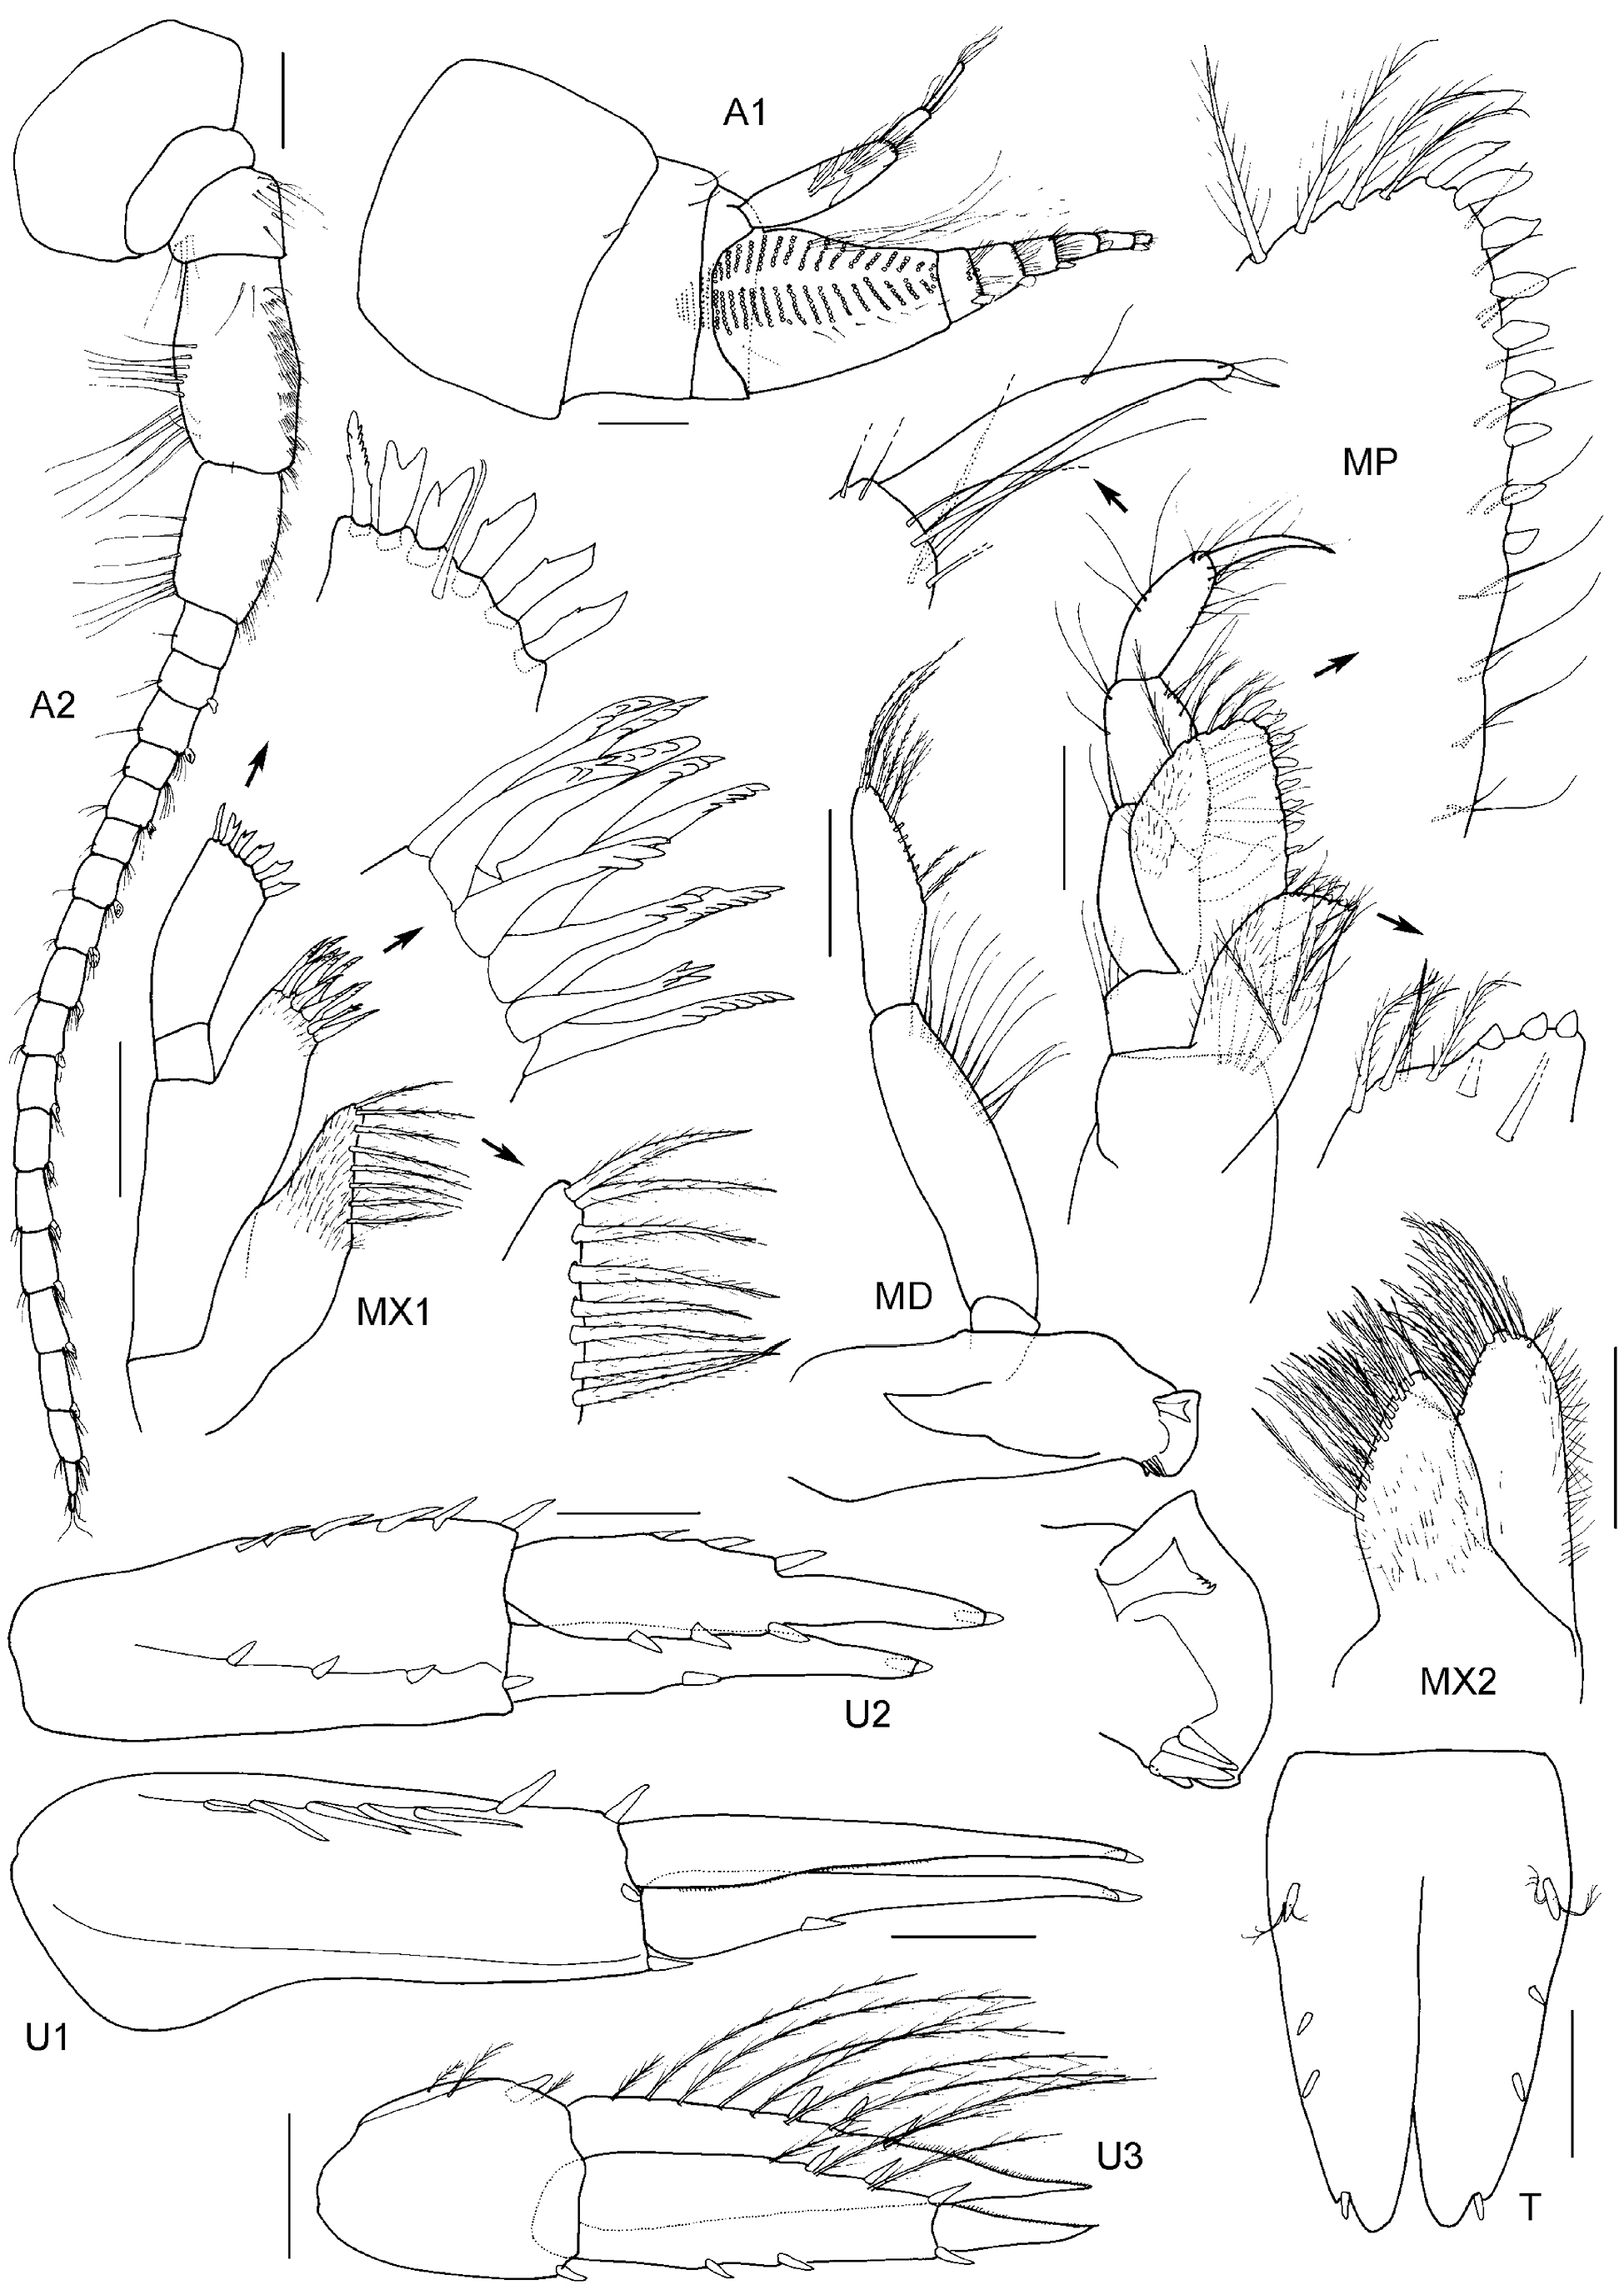
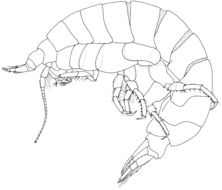
Figure 32.Paracallisoma zivianii sp. n. Holotype male, 12.0 mm, AM P.69091, from east of Flynn Reef, Queensland, Australia.
-
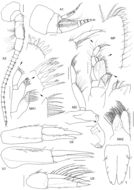
Figure 33.Paracallisoma zivianii sp. n. Holotype male, 12.0 mm, AM P.69091, from east of Flynn Reef, Queensland, Australia. Scales represent 0.2 mm.
-
Figure 34.Paracallisoma zivianii sp. n. Holotype male, 12.0 mm, AM P.69091, from east of Flynn Reef, Queensland, Australia. Scales represent 0.2 mm.
-
Figure 35.Distribution of Scopelocheiropsis abyssalis Schellenberg, 1926. Star indicates type locality.
-
Figure 36.Scopelocheiropsis abyssalis Schellenberg, 1926. Syntype female, 5 mm, ZMB 20319, mid Atlantic Ocean. Whole G1, G2, P4, P5 after Schellenberg 1926. Scales for P3, P7 represent 0.5 mm, remainder represent 0.1 mm.
-
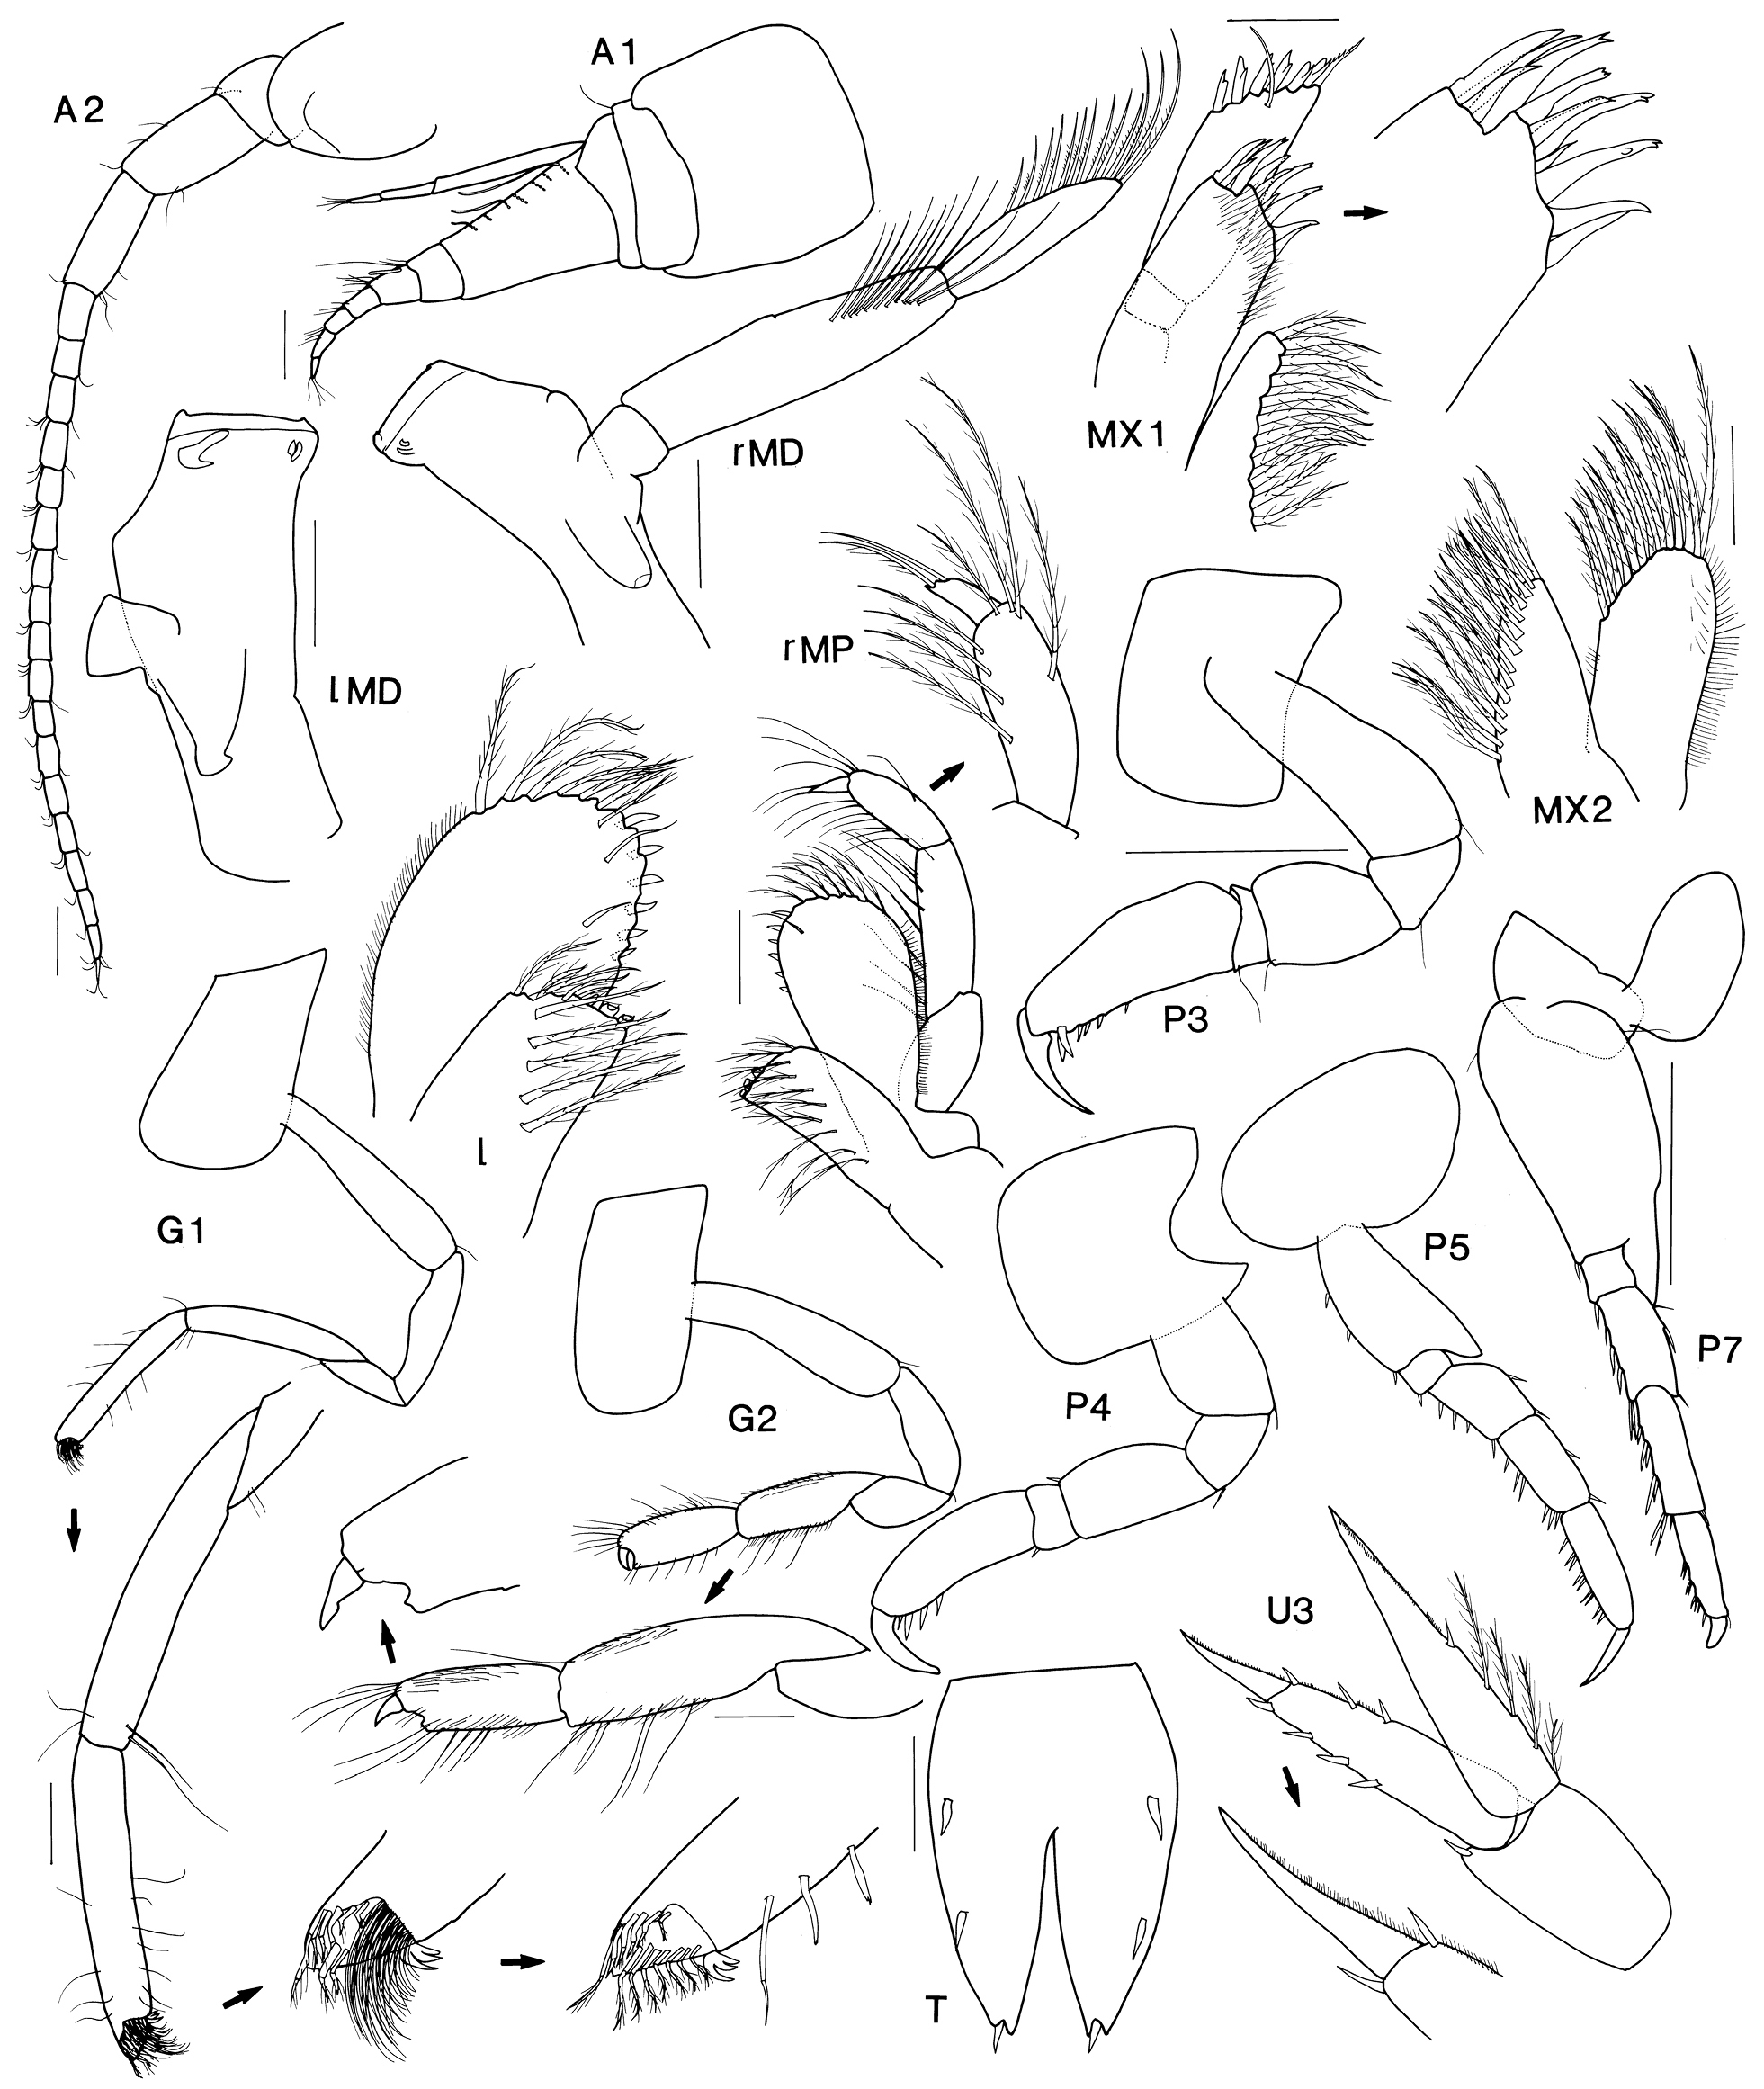
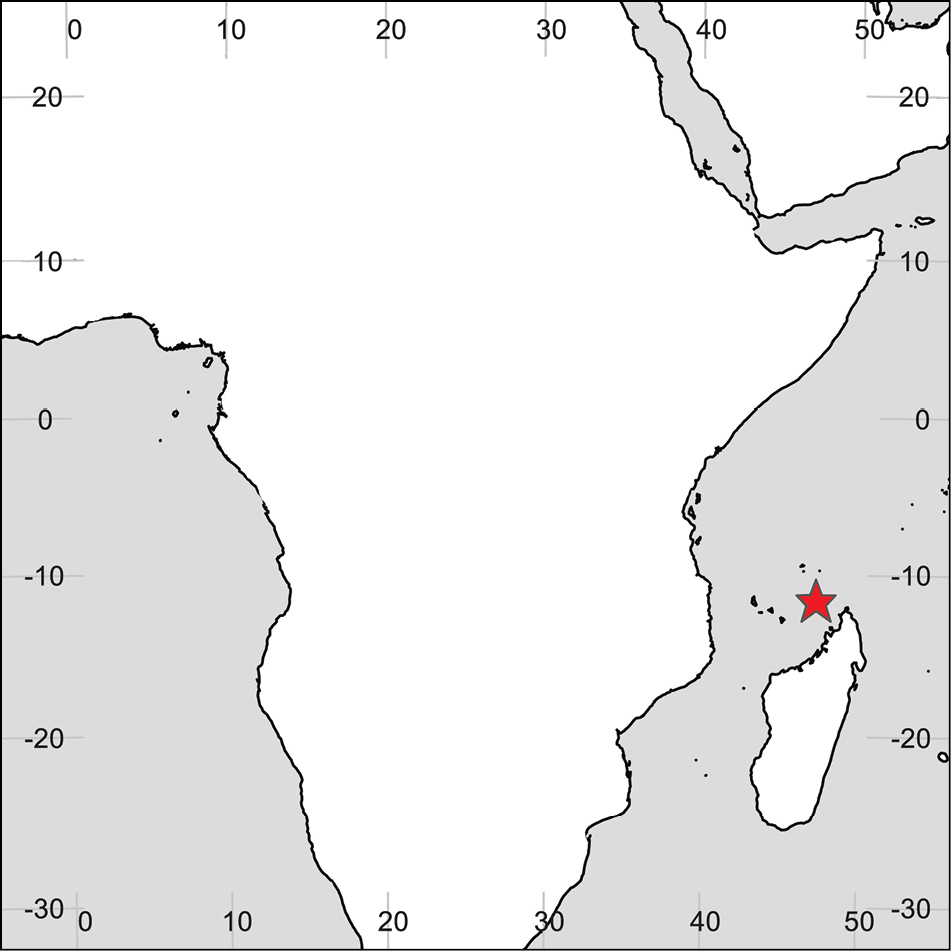
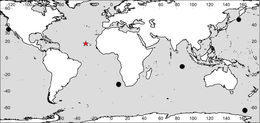
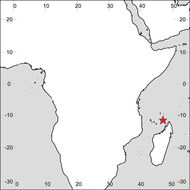
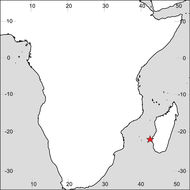
Figure 37.Distribution of Scopelocheiropsis armata (Ledoyer, 1986).
-
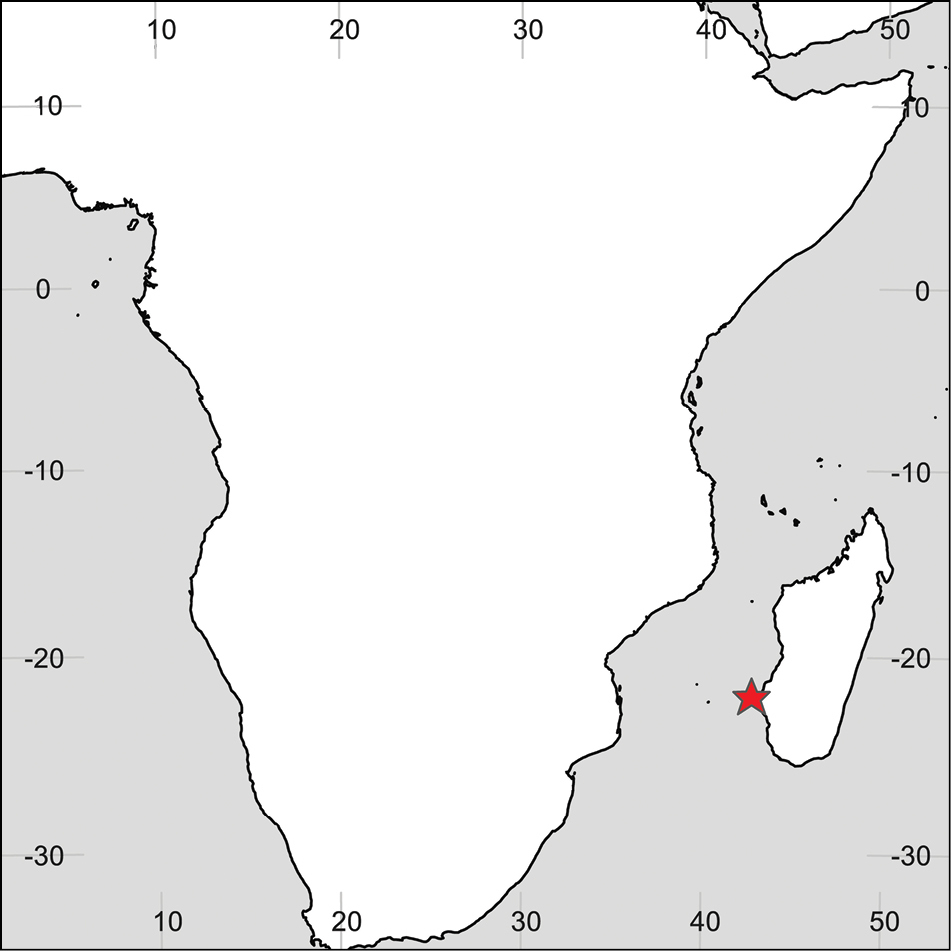
Figure 38.Distribution of Scopelocheiropsis sublitoralis Vinogradov, 2004.
-
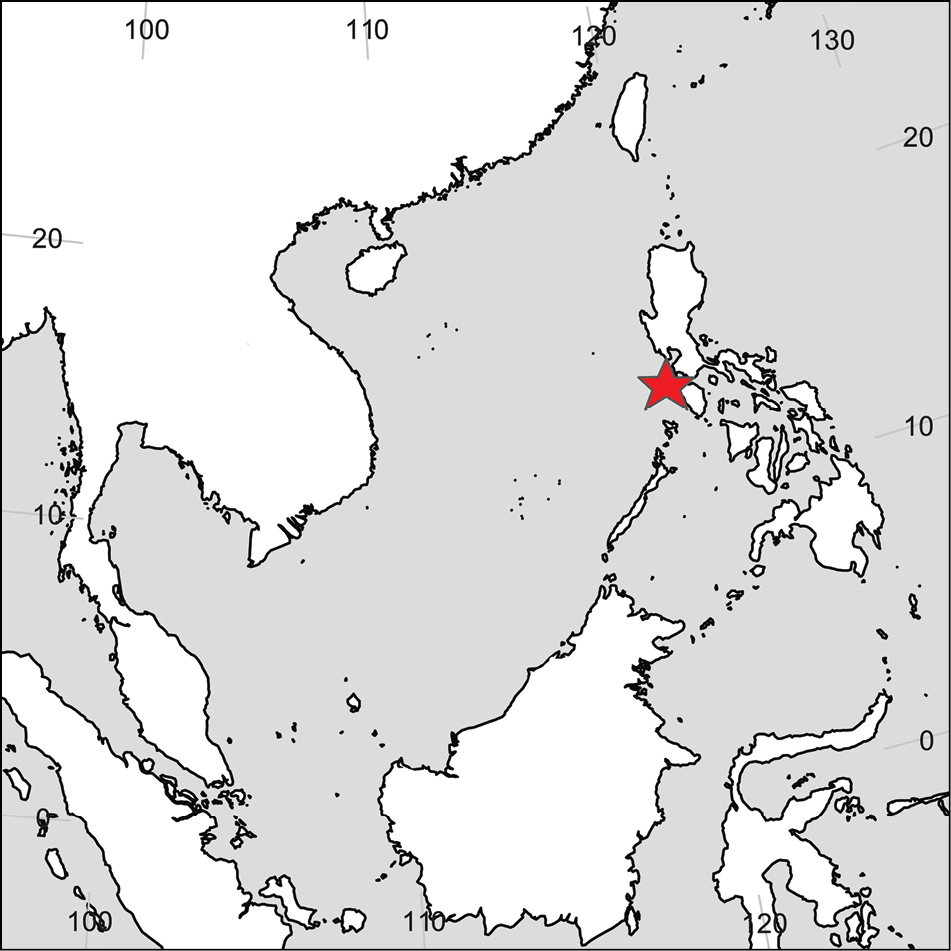
Figure 39.Distribution of Tayabasa barnardi (Lowry & Stoddart, 1993).