-
Figure 19.Distribution of Eucallisoma glandulosa J.L. Barnard, 1961.
-
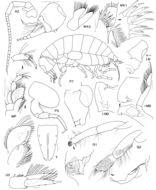
Figure 20.Eucallisoma glandulosa J.L. Barnard. Holotype, ?male, 10 mm, ZMUC CRU-1720, off Gabon, east Atlantic Ocean. Scales for antennae, gnathopods, pereopods represent 0.5 mm; remainder represent 0.1 mm.
-
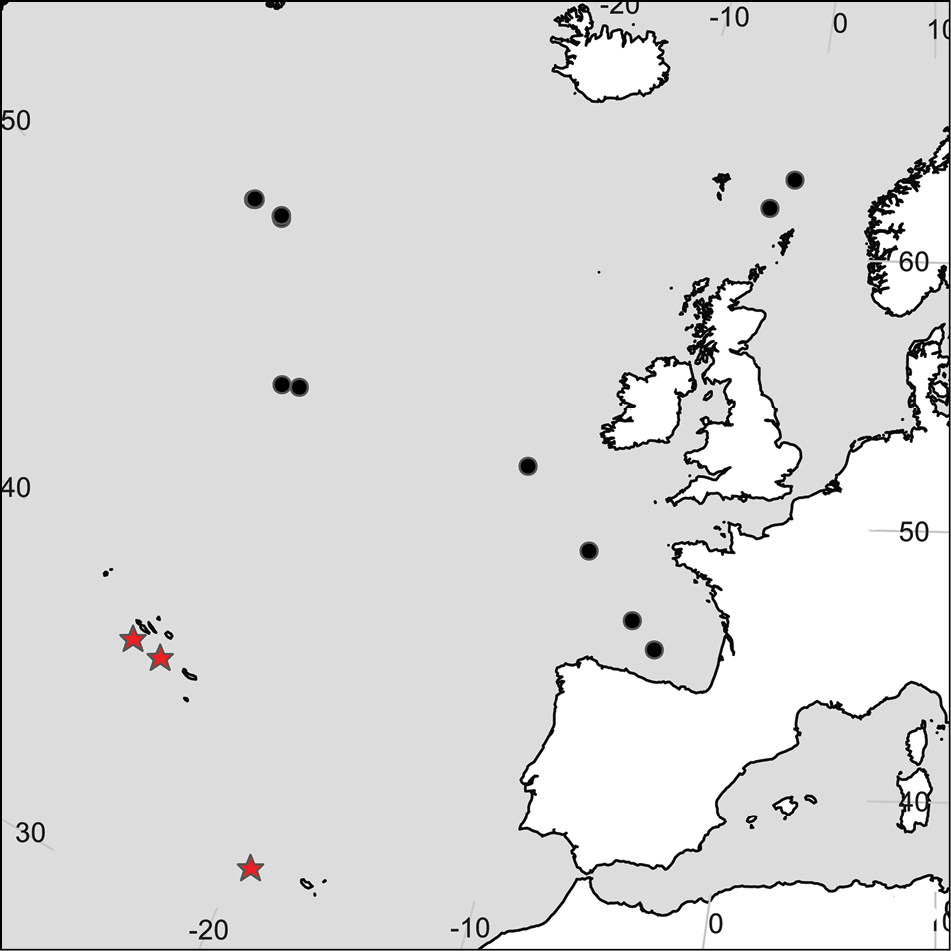
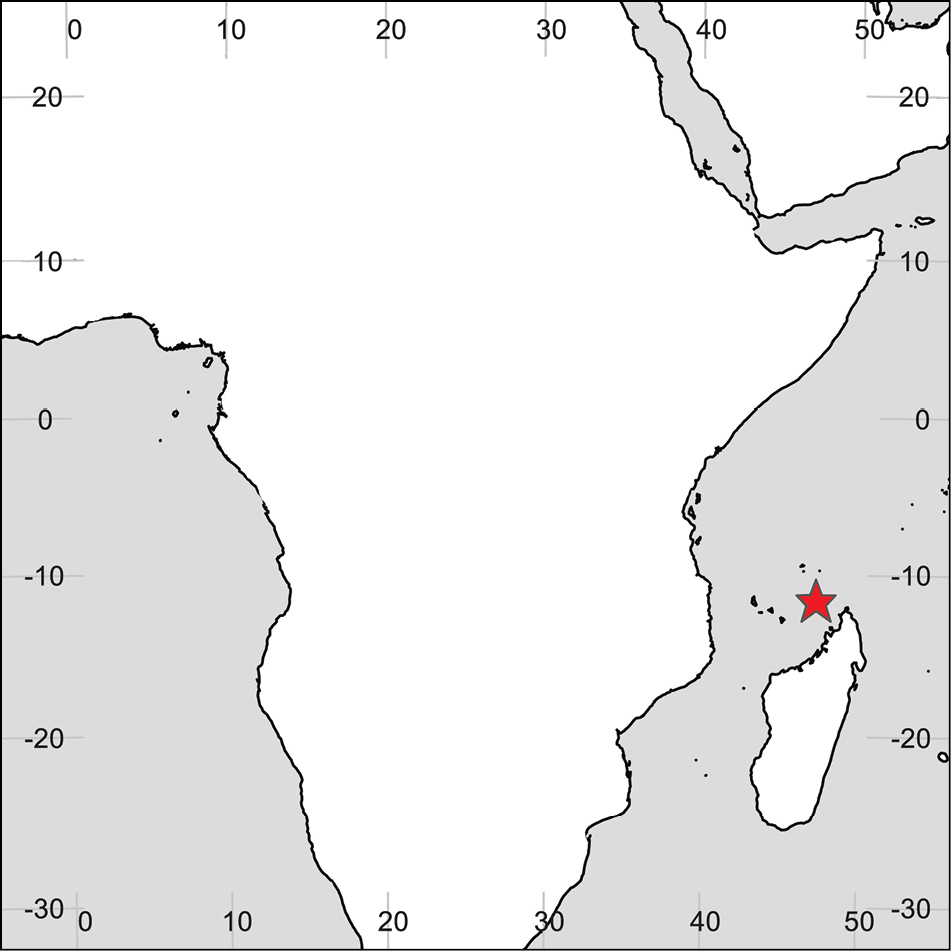
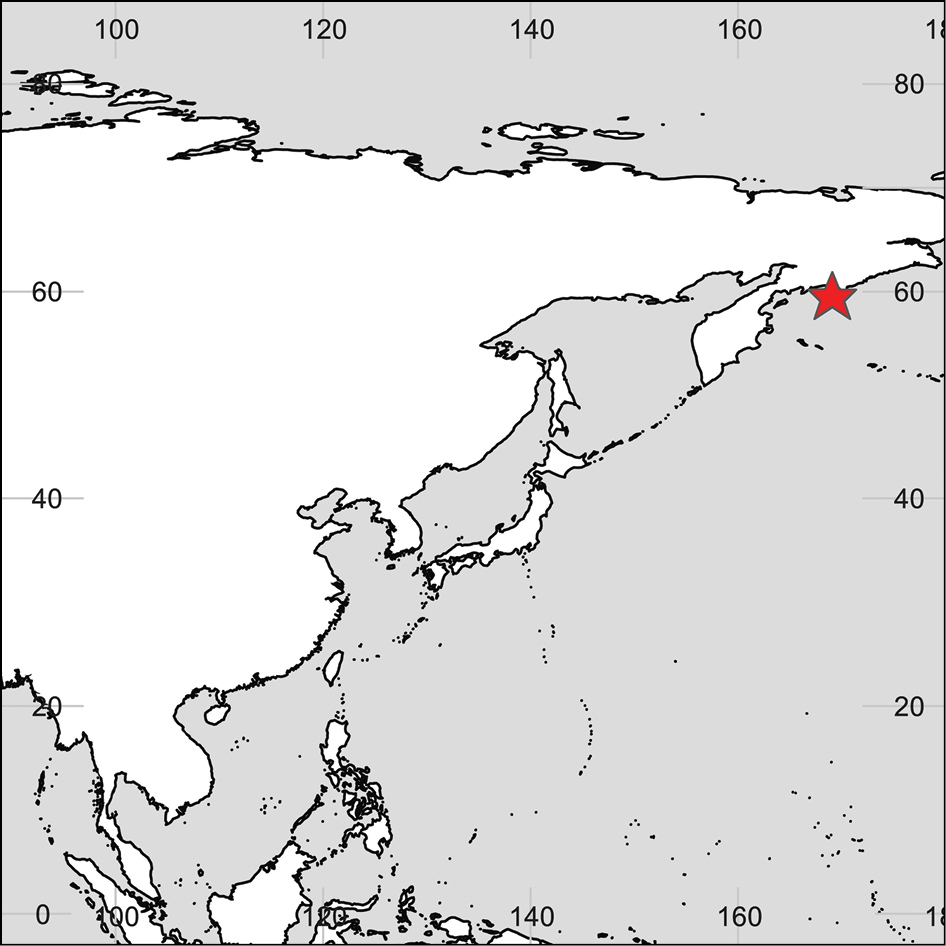
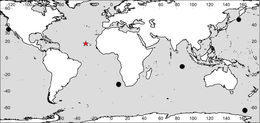
Figure 22.Distribution of Paracallisoma alberti Chevreux, 1903. Star indicates type locality.
-
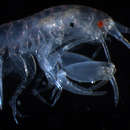
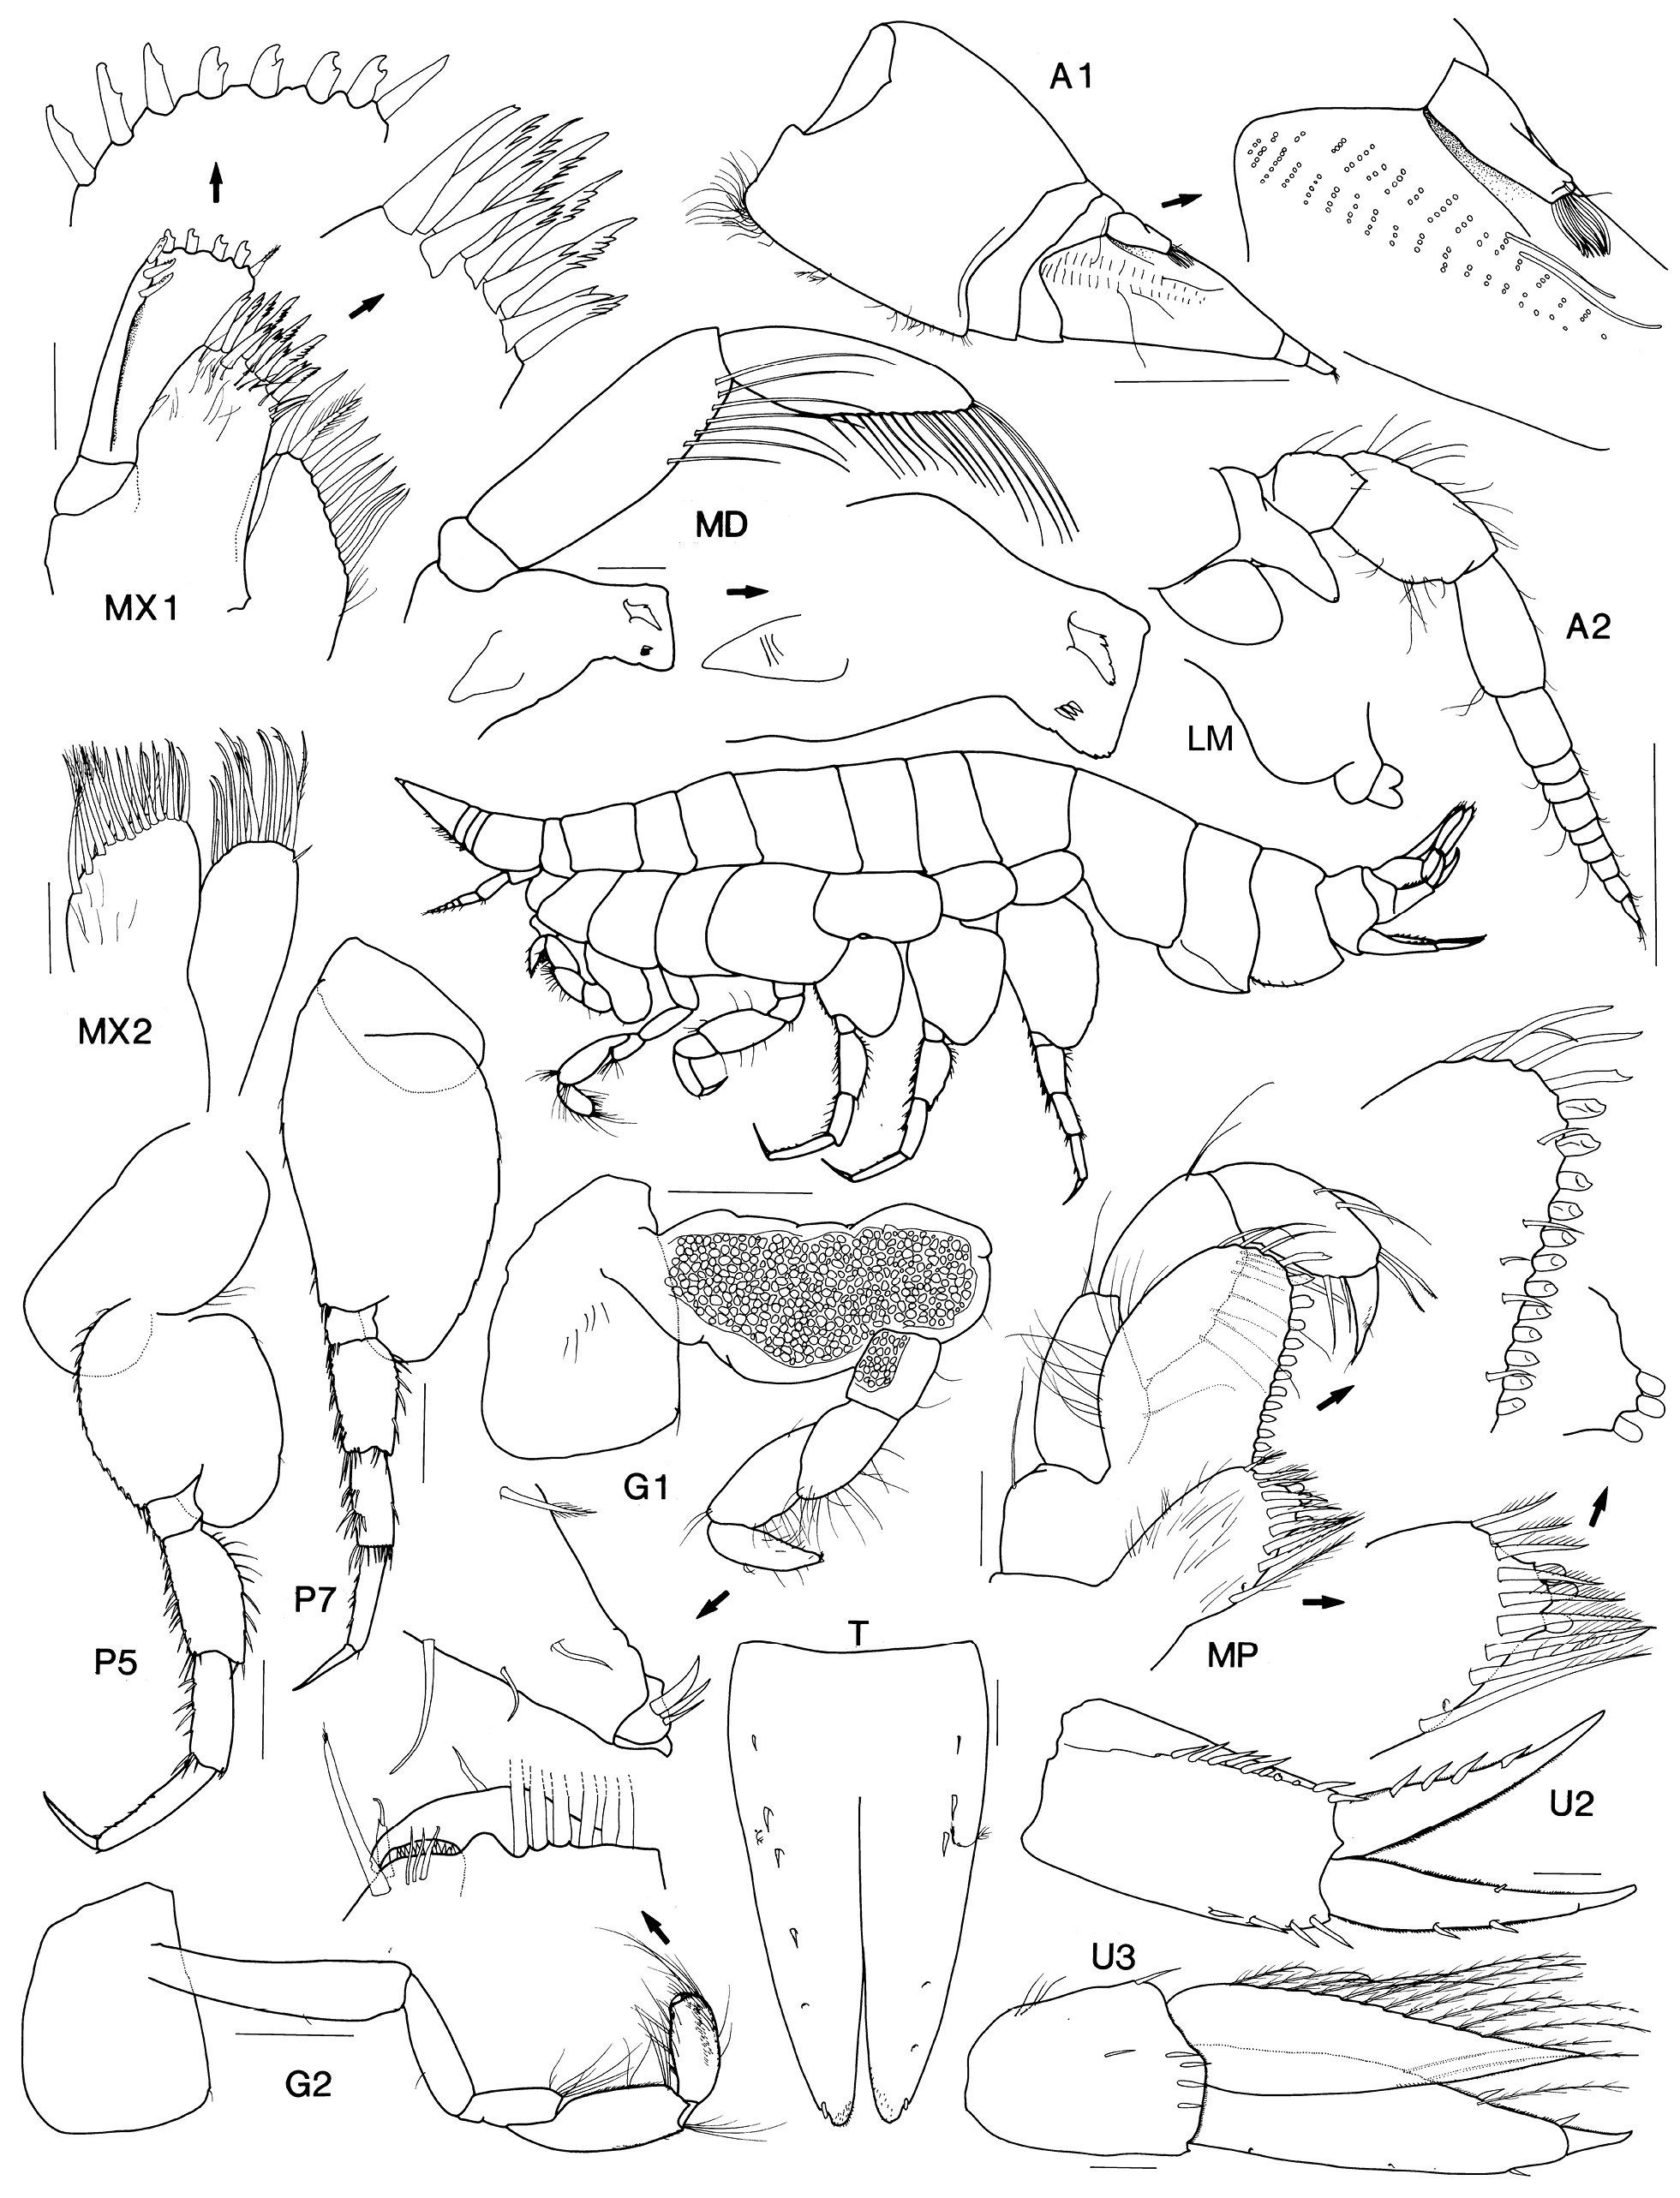
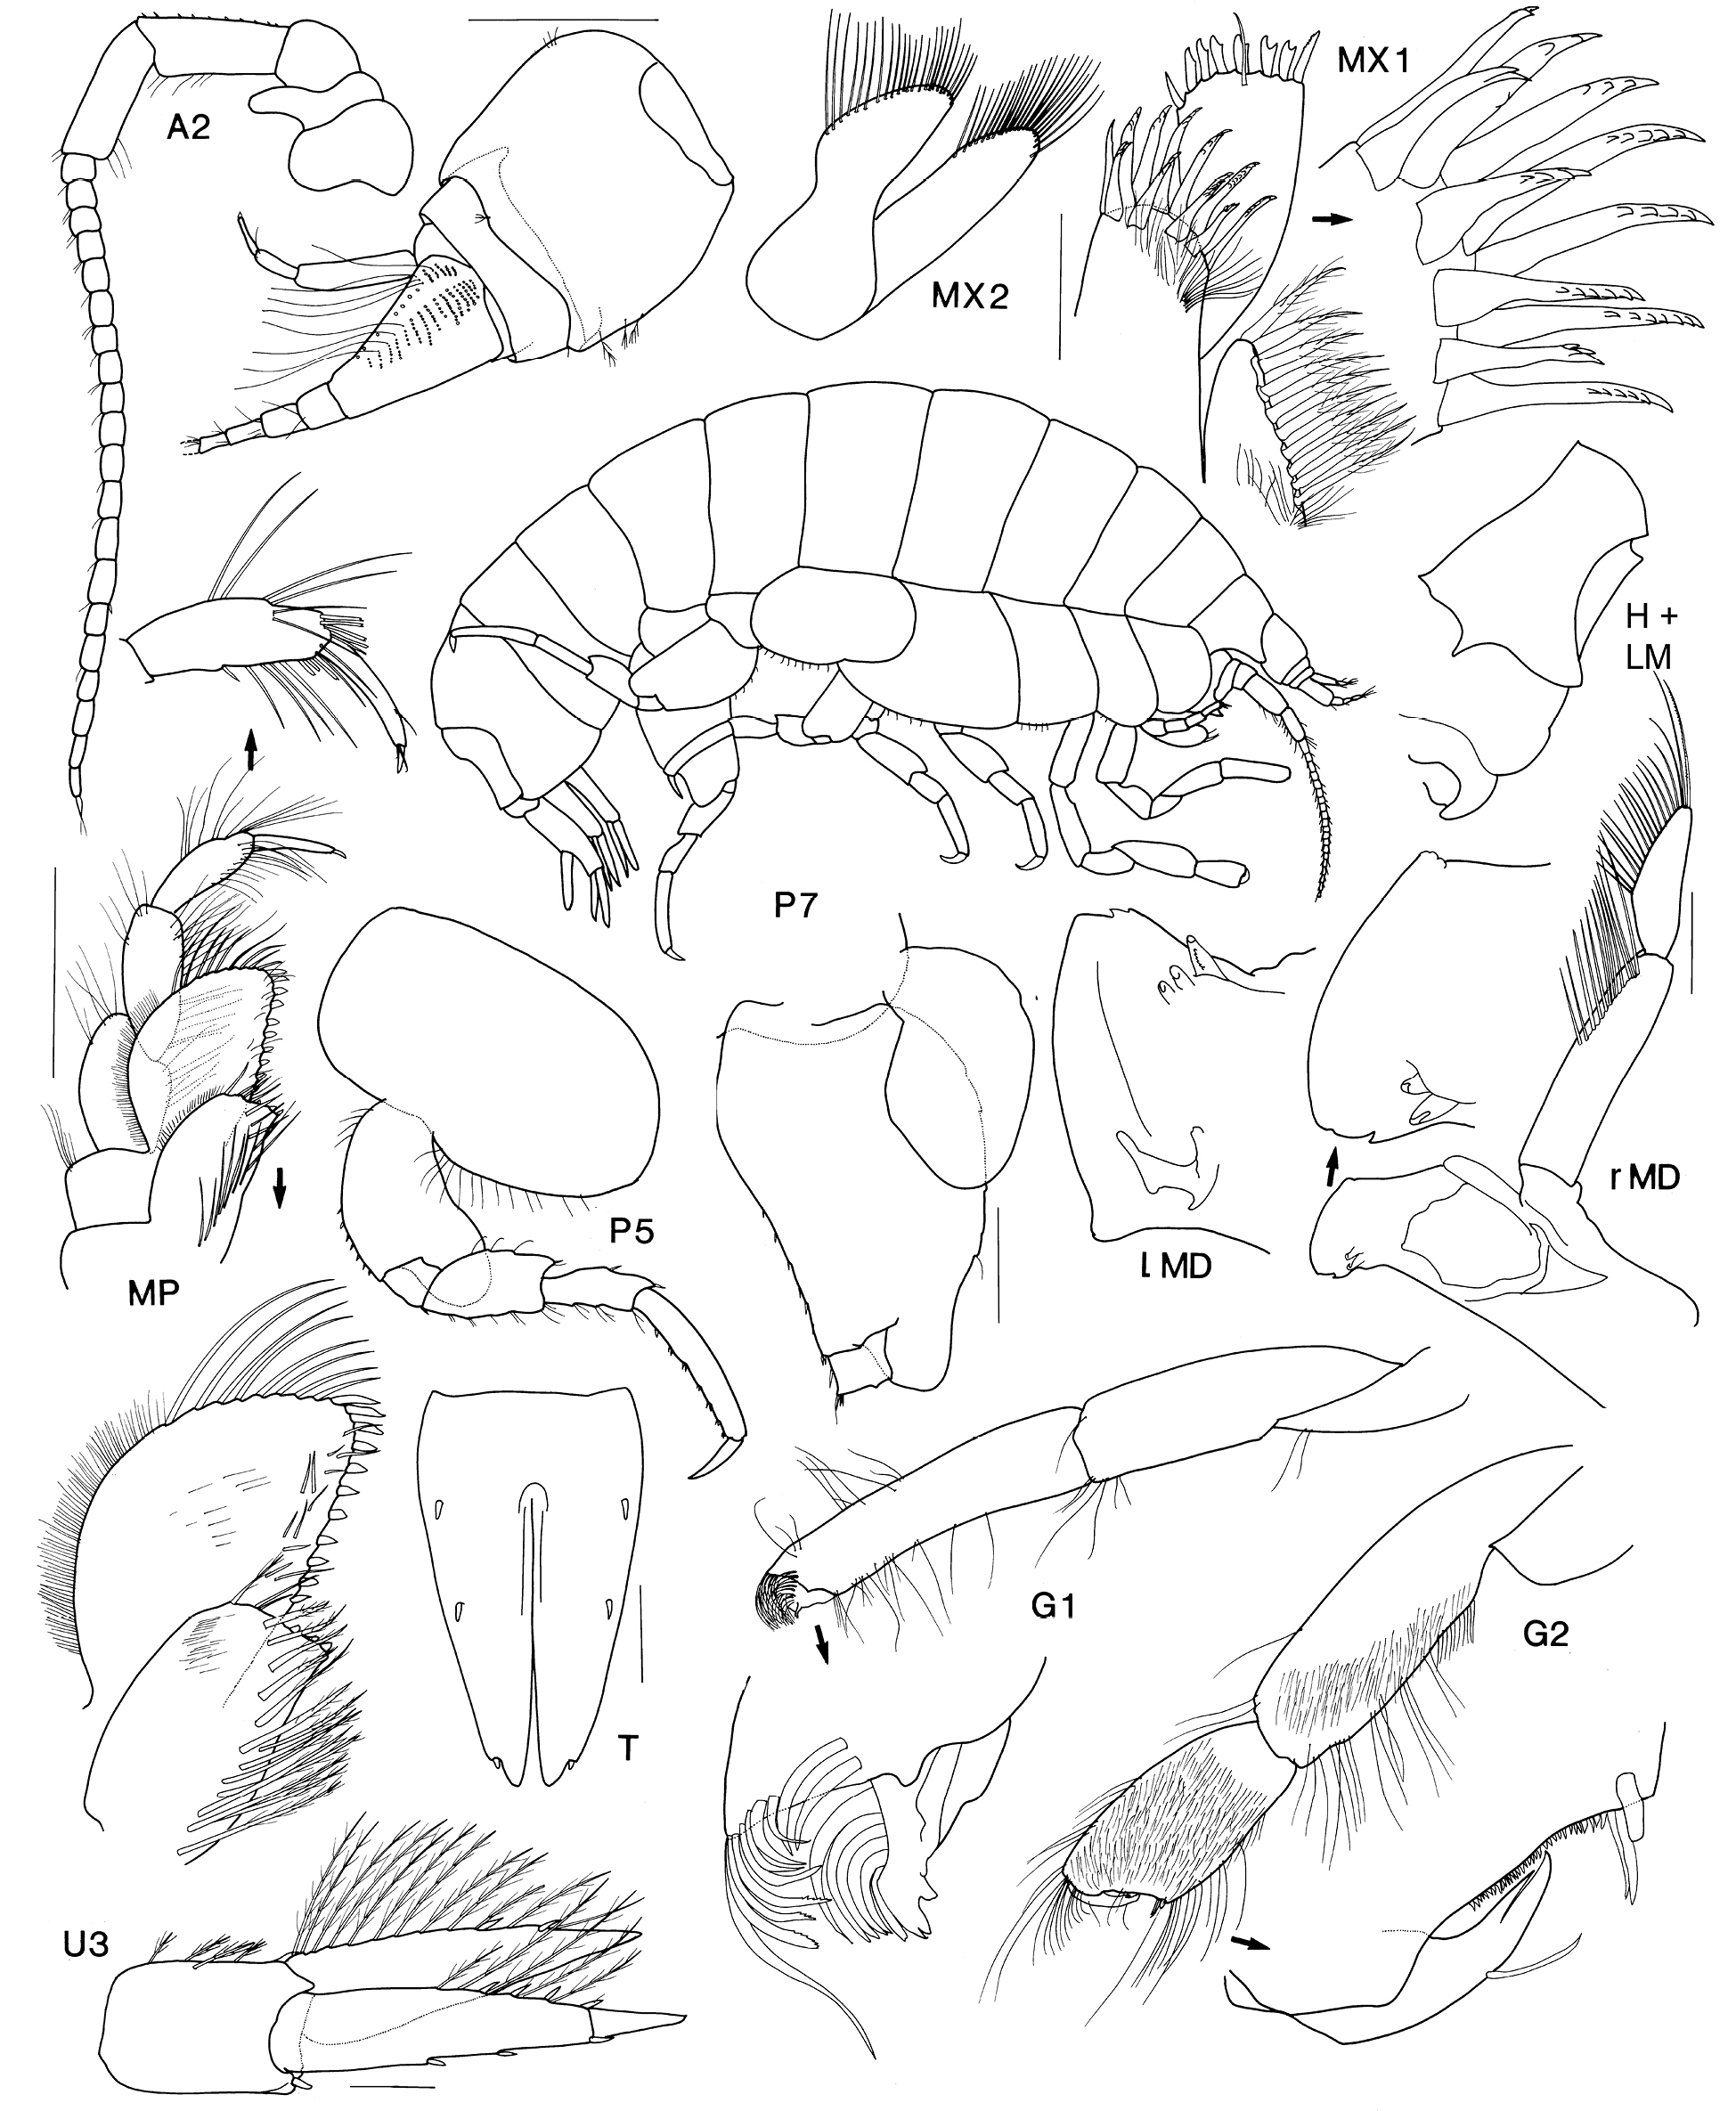
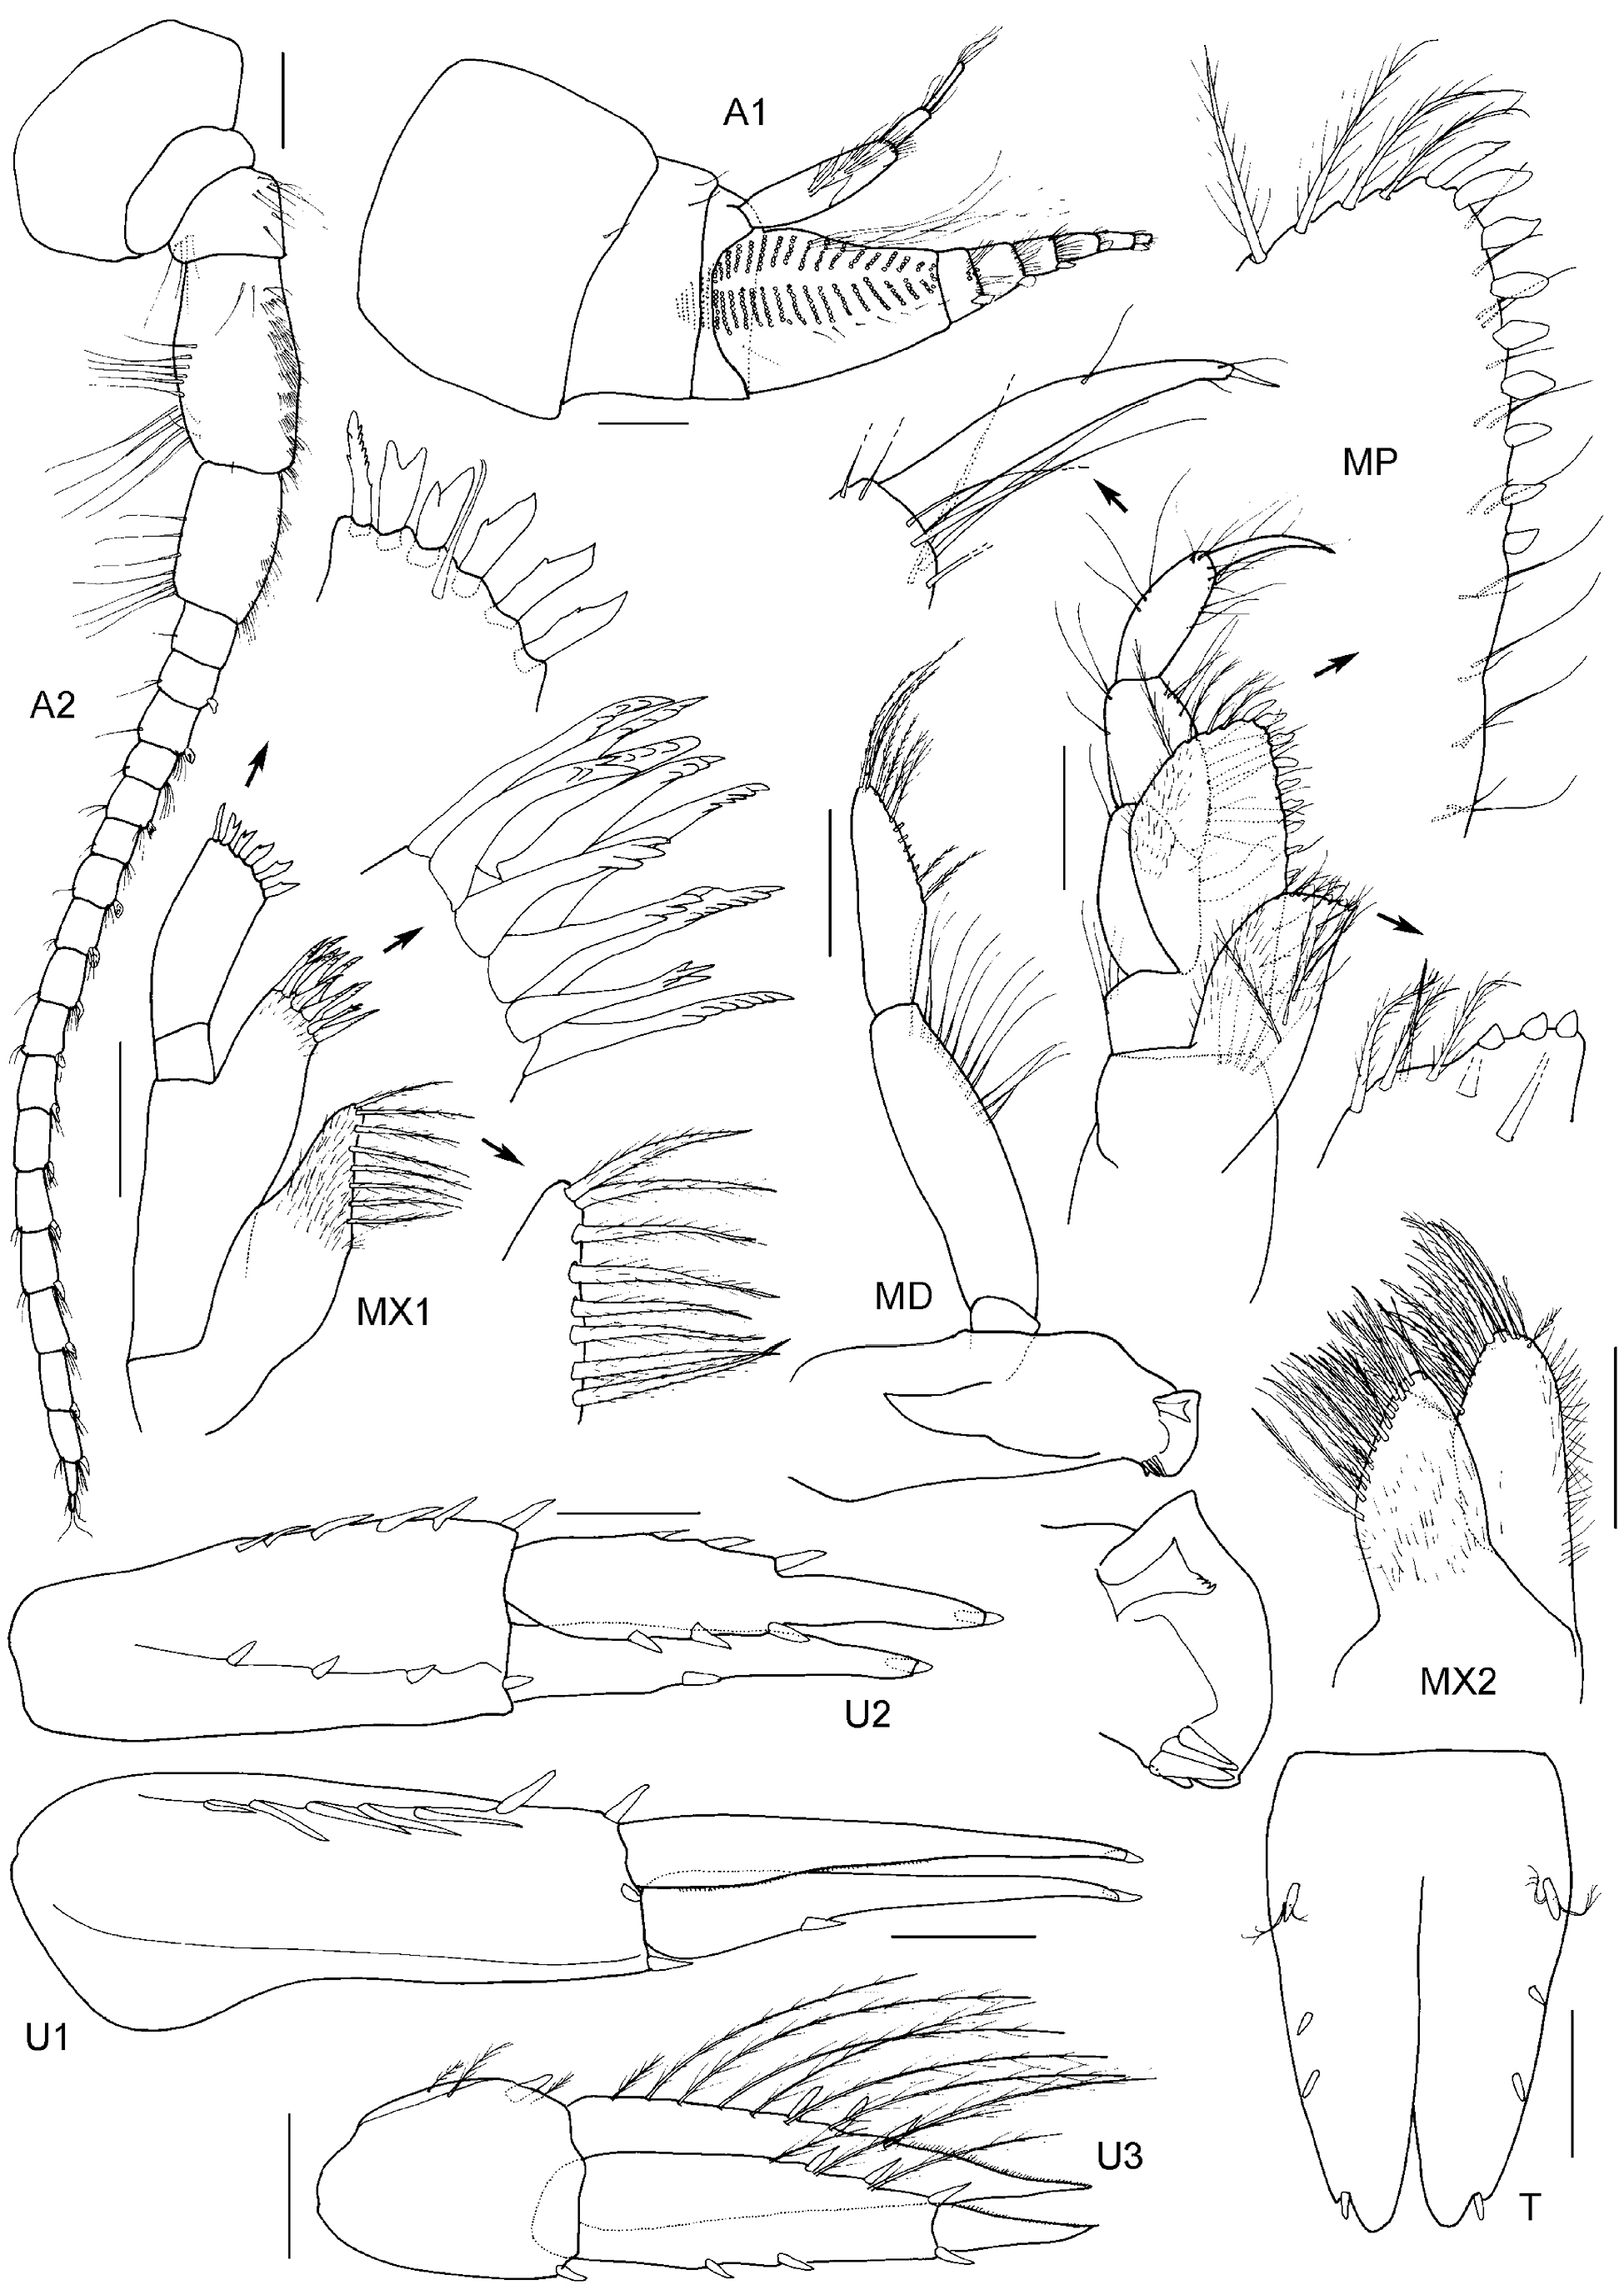
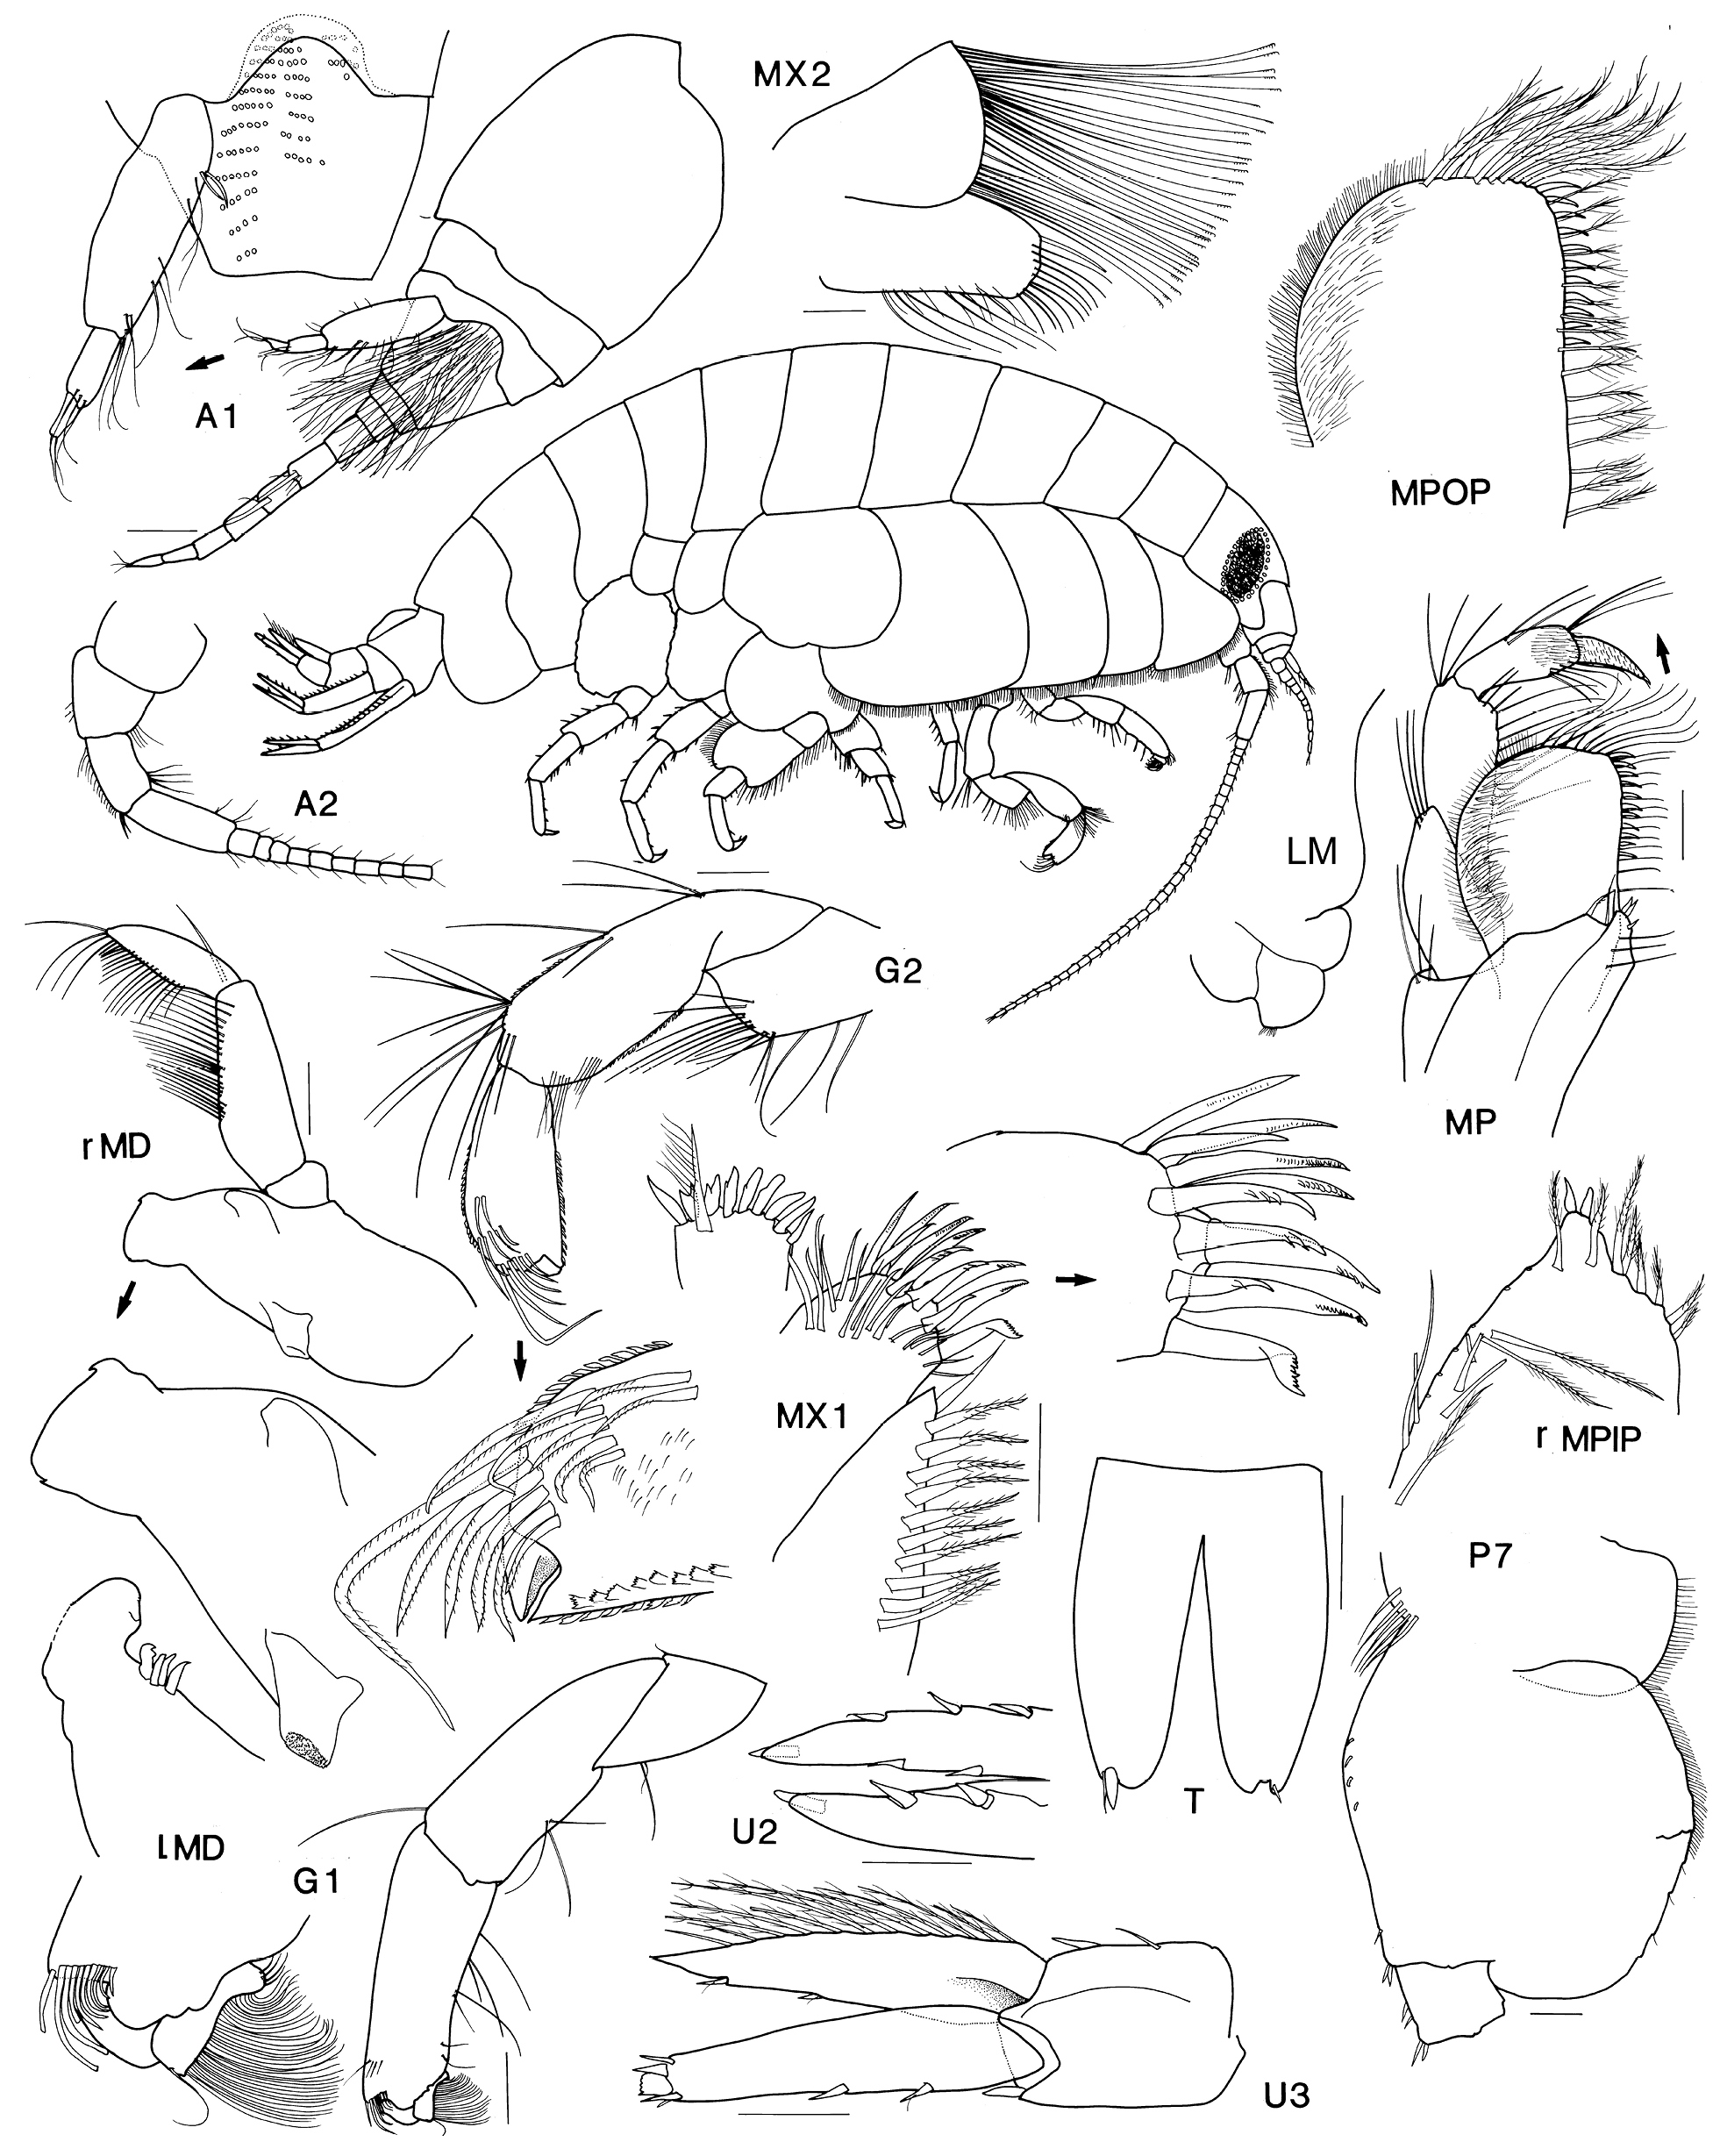
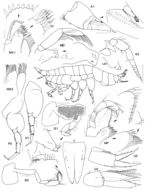
Figure 23.Paracallisoma alberti Chevreux, 1903. Syntype female, MOM, near Madeira, North Atlantic Ocean. Whole animal after Chevreux 1903; A2, MX2, P5 after Chevreux 1935. Scales for MD, MX1, U3, T represent 0.2 m; remainder represent 0.5 mm.
-
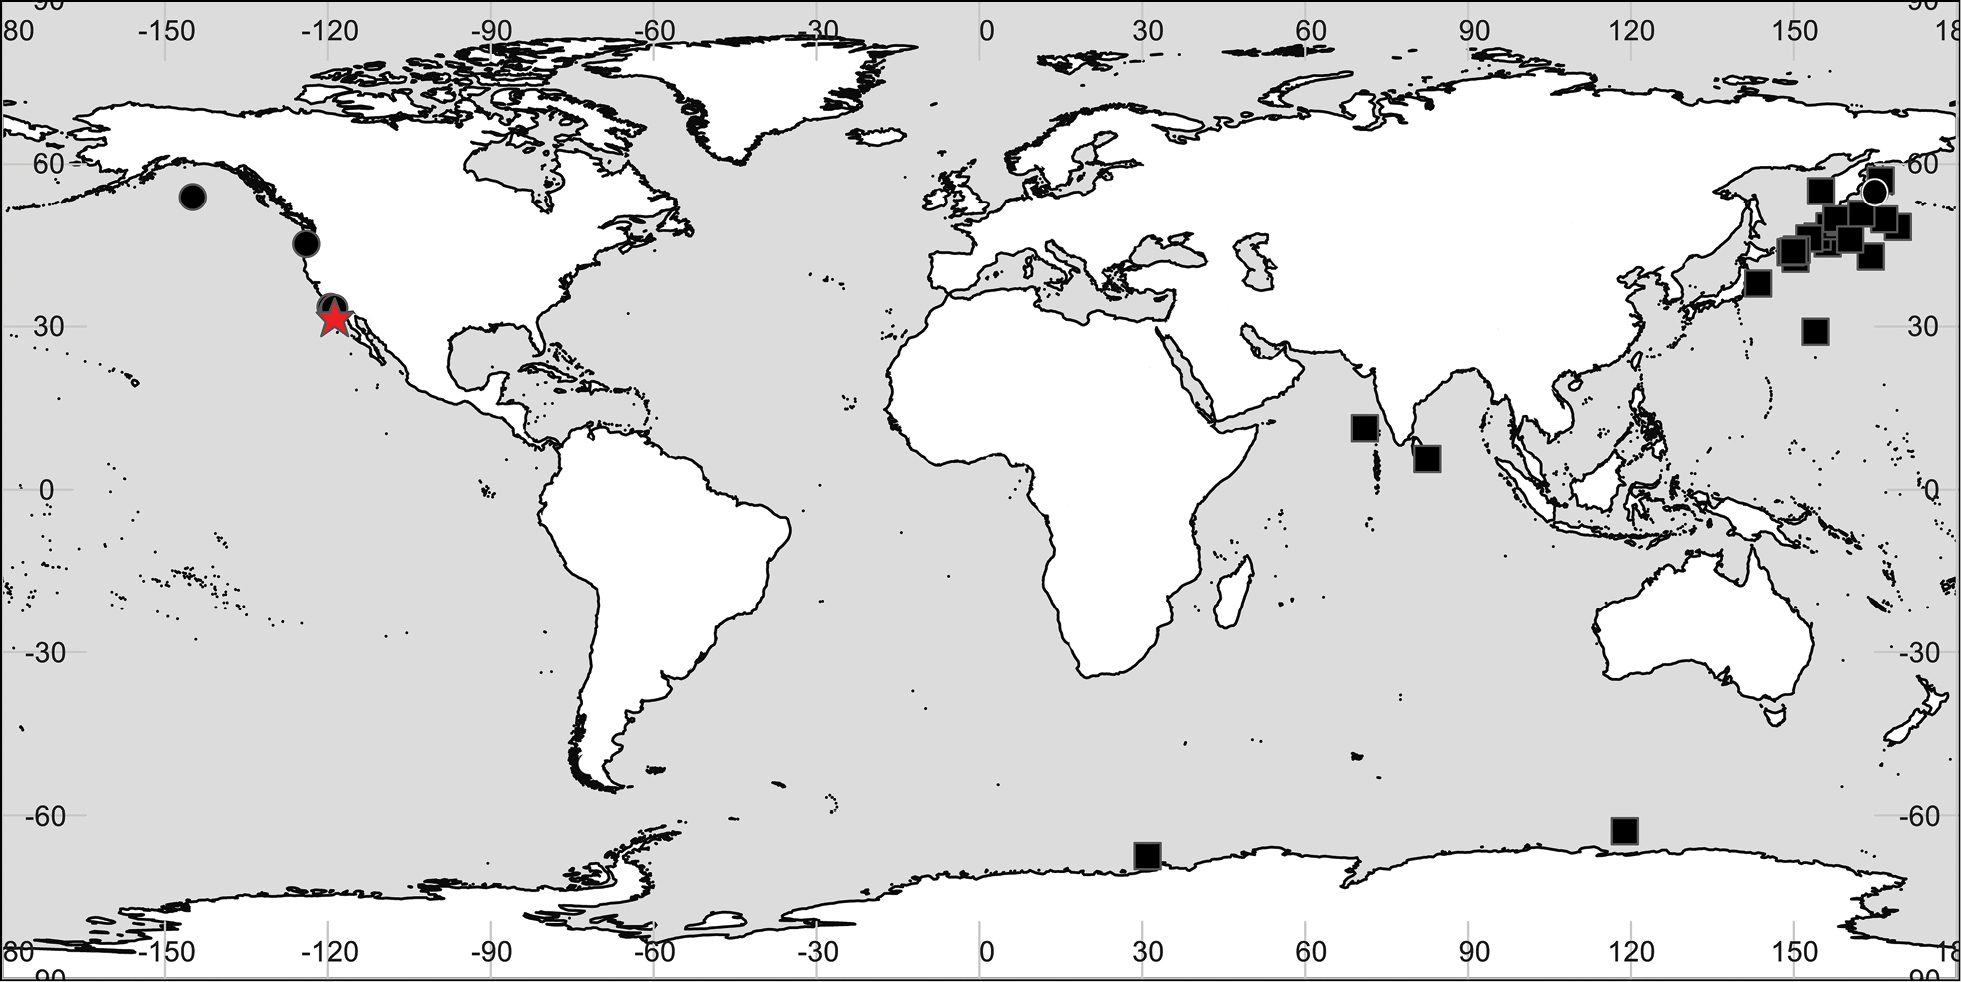
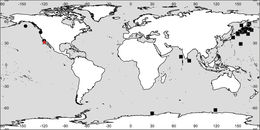
Figure 24.Distribution of Paracallisoma coecum (Holmes, 1908). Circles (●) represent records of Paracallisoma coecum; squares (■) represent misidentifications of Paracallisoma alberti that may represent Paracallisoma coecum or another species. Star indicates type locality.
-
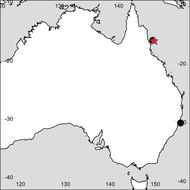
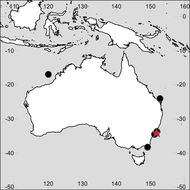
Figure 31.Distribution of Paracallisoma zivianii sp. n. Star indicates type locality.
-
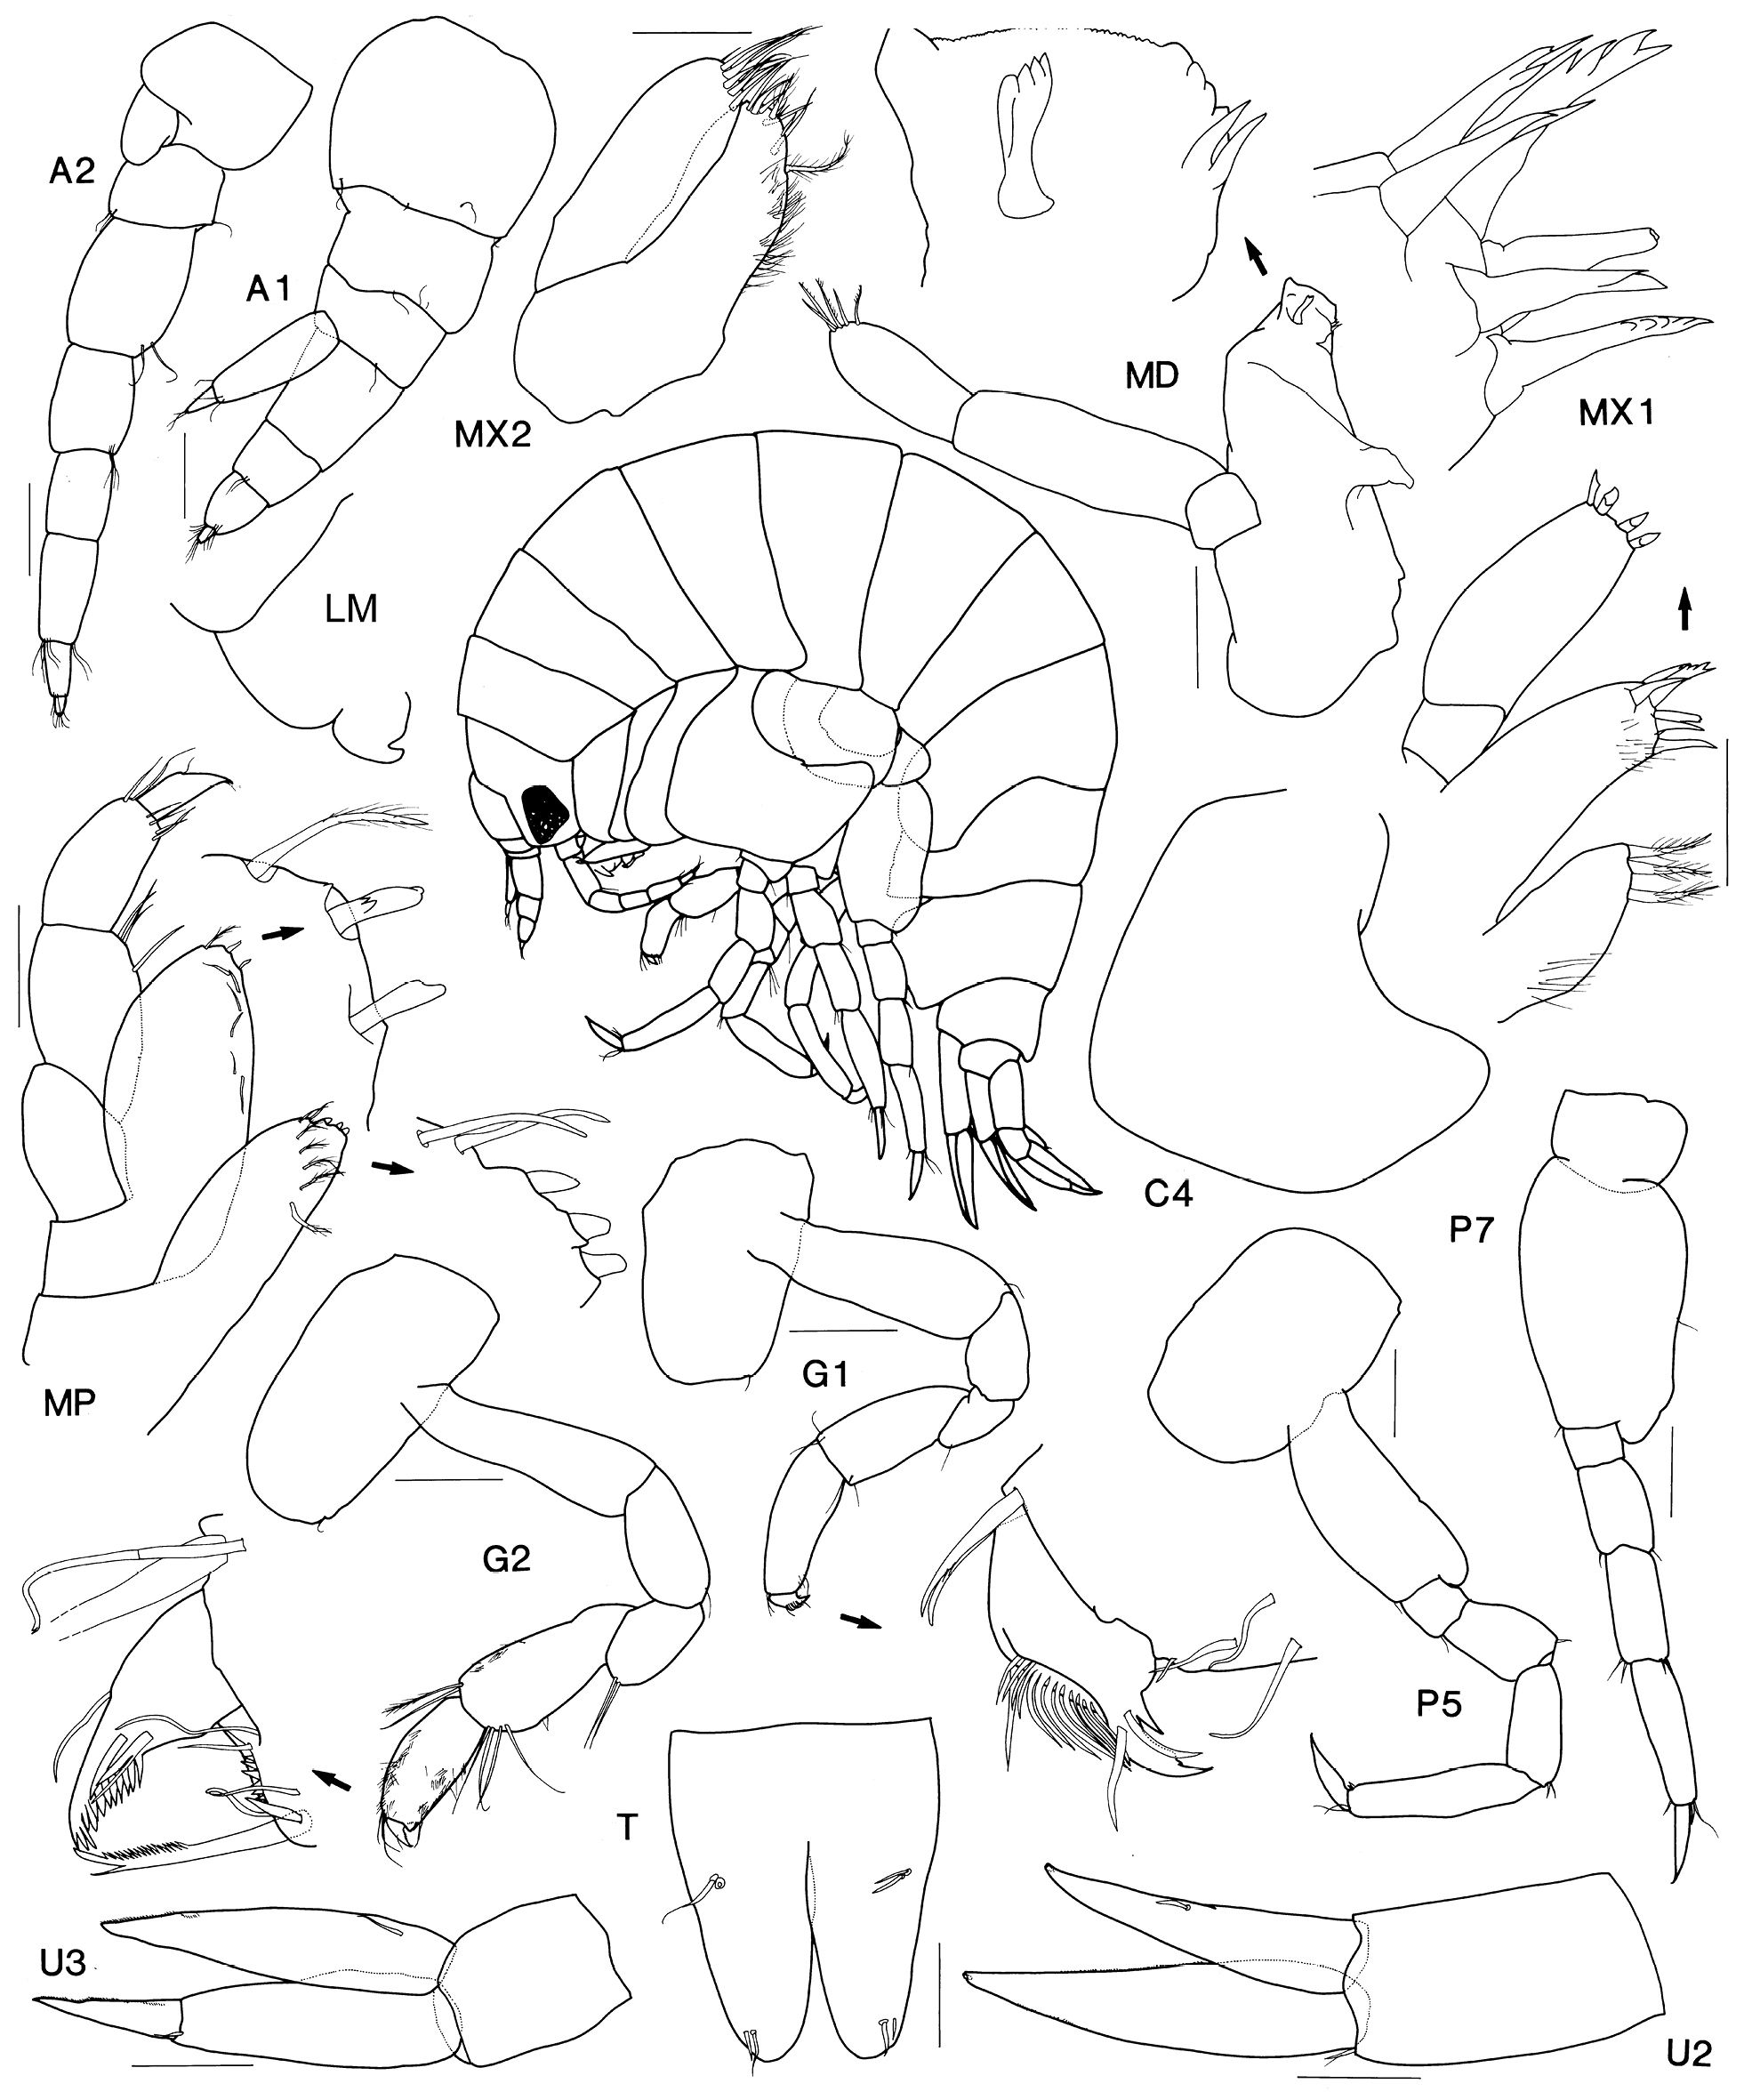
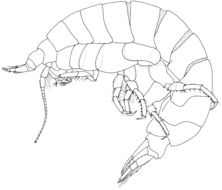
Figure 32.Paracallisoma zivianii sp. n. Holotype male, 12.0 mm, AM P.69091, from east of Flynn Reef, Queensland, Australia.
-
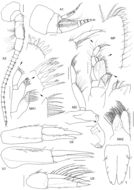
Figure 33.Paracallisoma zivianii sp. n. Holotype male, 12.0 mm, AM P.69091, from east of Flynn Reef, Queensland, Australia. Scales represent 0.2 mm.
-
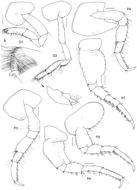
Figure 34.Paracallisoma zivianii sp. n. Holotype male, 12.0 mm, AM P.69091, from east of Flynn Reef, Queensland, Australia. Scales represent 0.2 mm.
-
Figure 35.Distribution of Scopelocheiropsis abyssalis Schellenberg, 1926. Star indicates type locality.
-
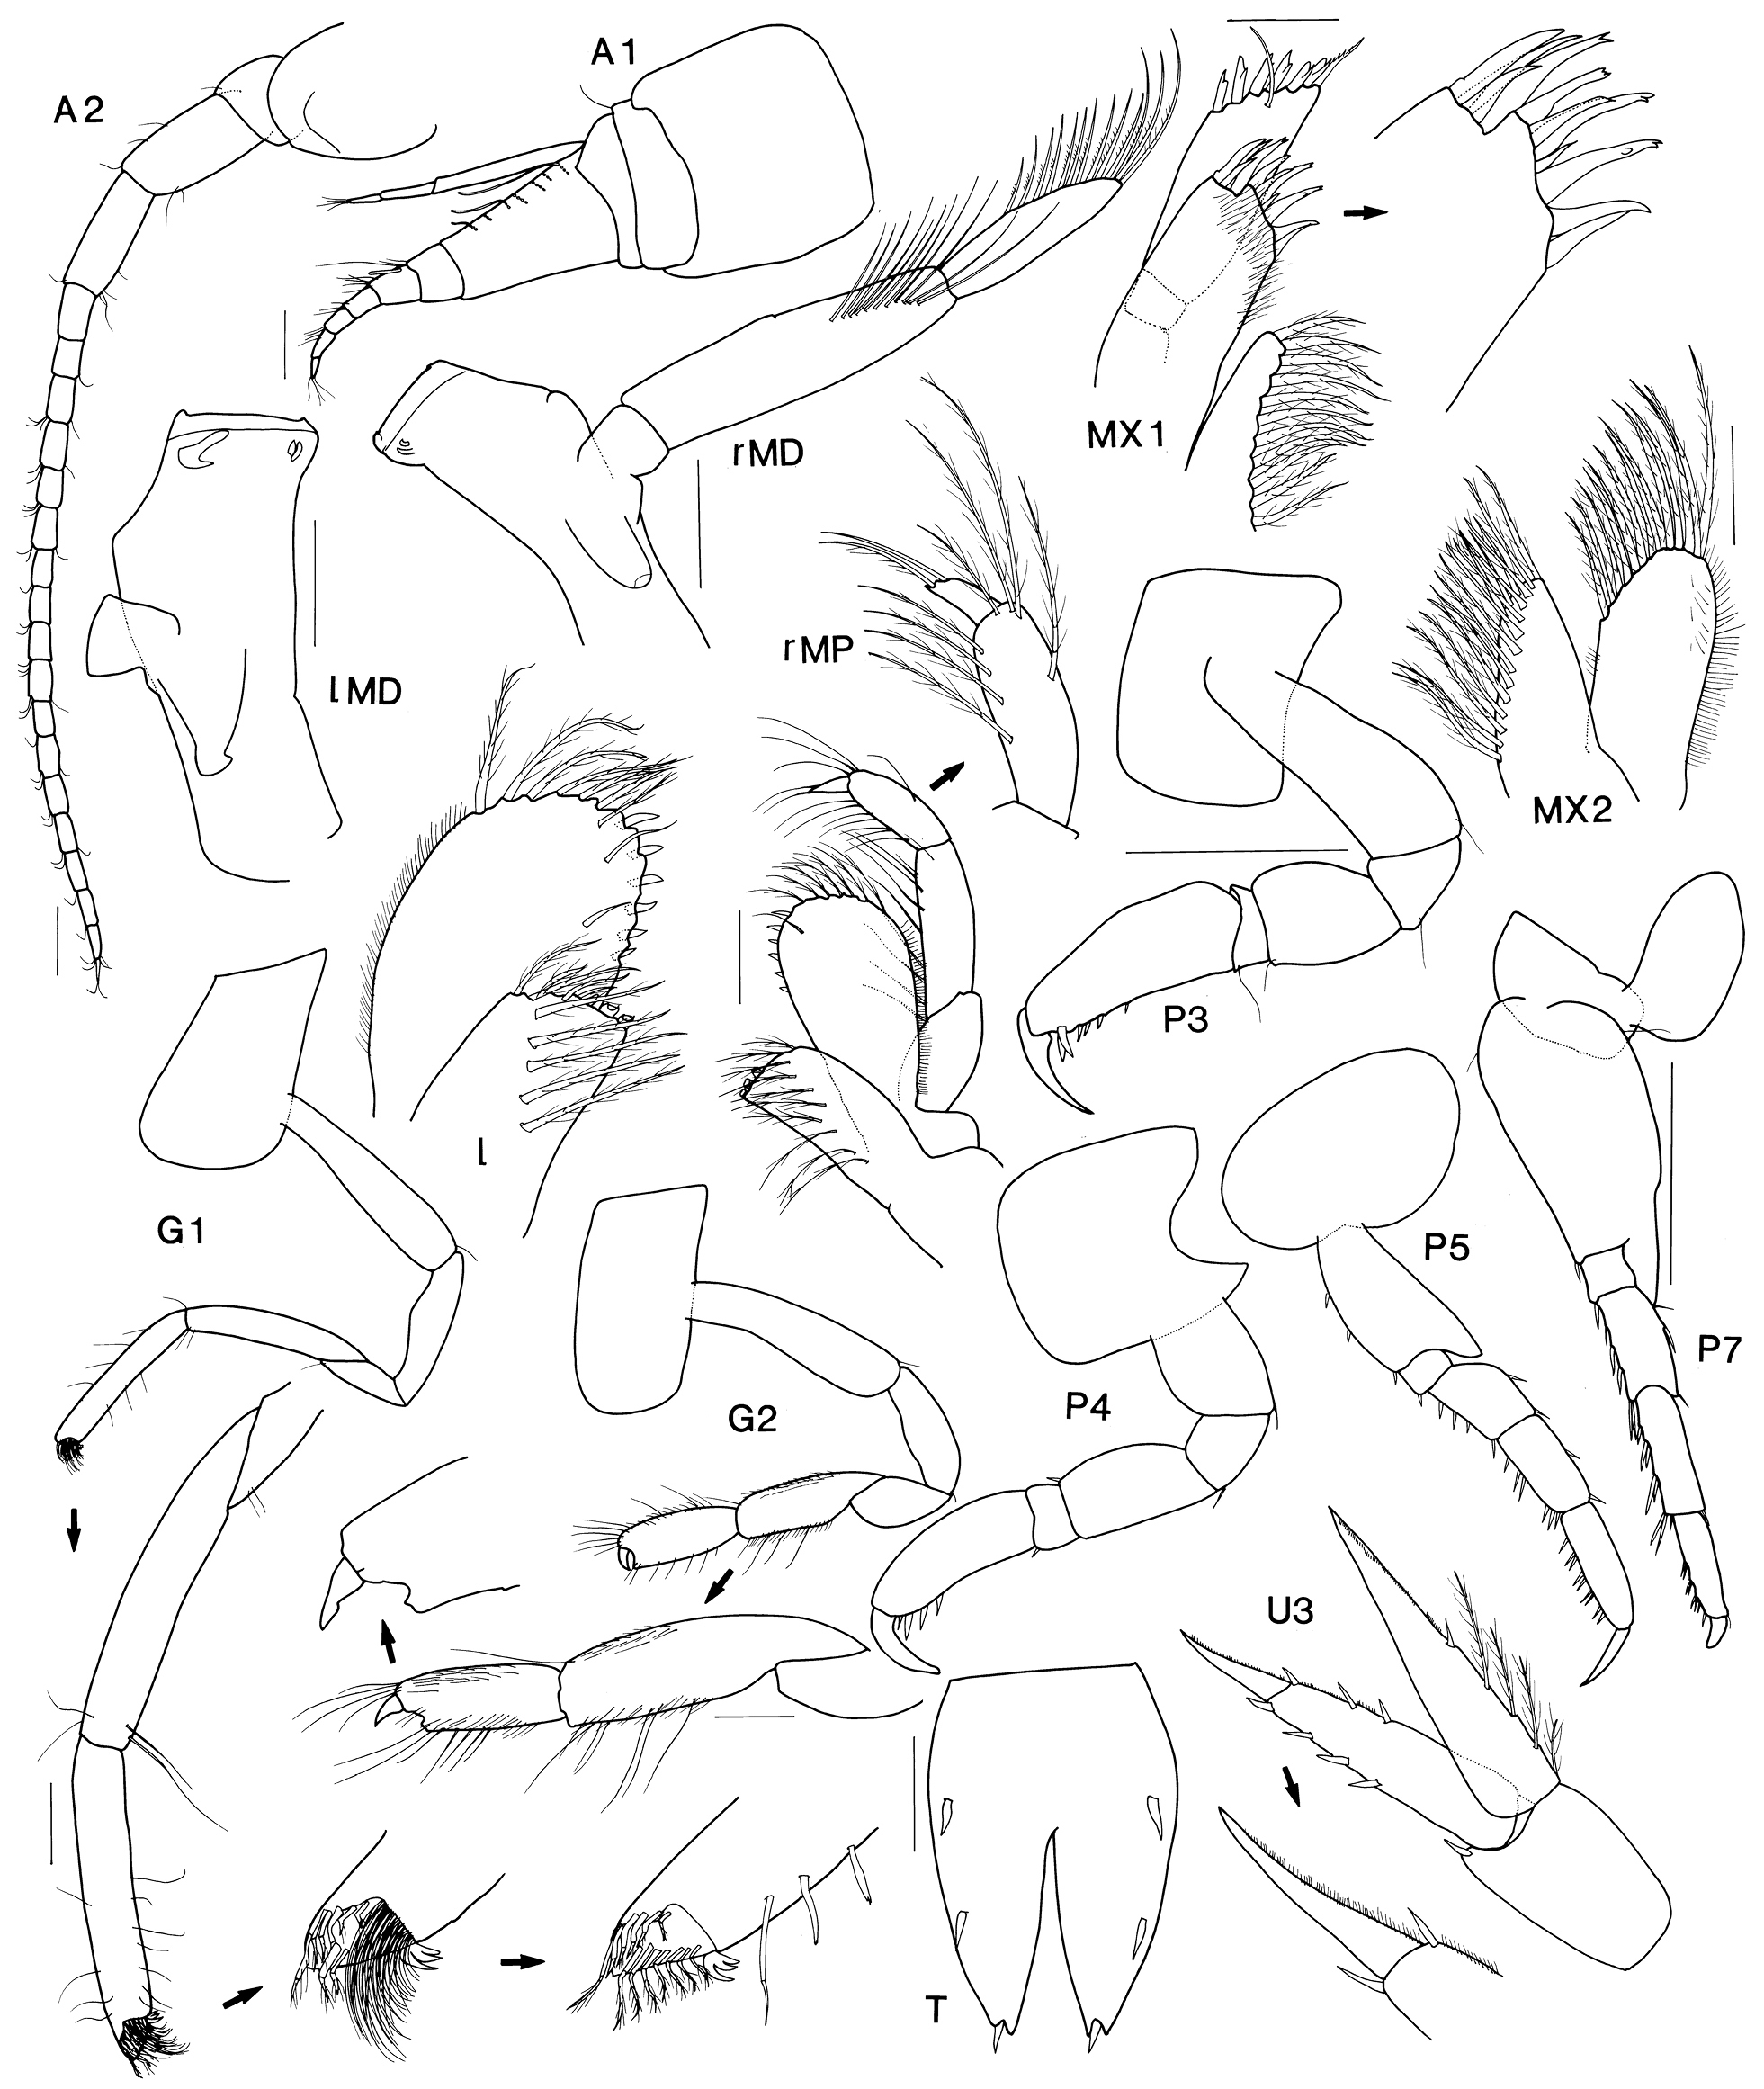
Figure 36.Scopelocheiropsis abyssalis Schellenberg, 1926. Syntype female, 5 mm, ZMB 20319, mid Atlantic Ocean. Whole G1, G2, P4, P5 after Schellenberg 1926. Scales for P3, P7 represent 0.5 mm, remainder represent 0.1 mm.
-
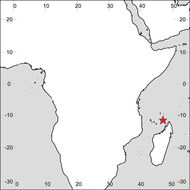
Figure 37.Distribution of Scopelocheiropsis armata (Ledoyer, 1986).
-
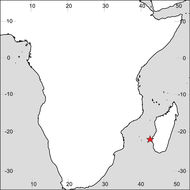
Figure 38.Distribution of Scopelocheiropsis sublitoralis Vinogradov, 2004.
-
Figure 39.Distribution of Tayabasa barnardi (Lowry & Stoddart, 1993).
-
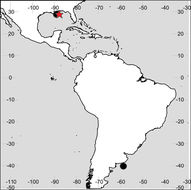
Figure 1.Distribution of Aroui americana Lowry & Stoddart, 1997. Star indicates type locality.
-
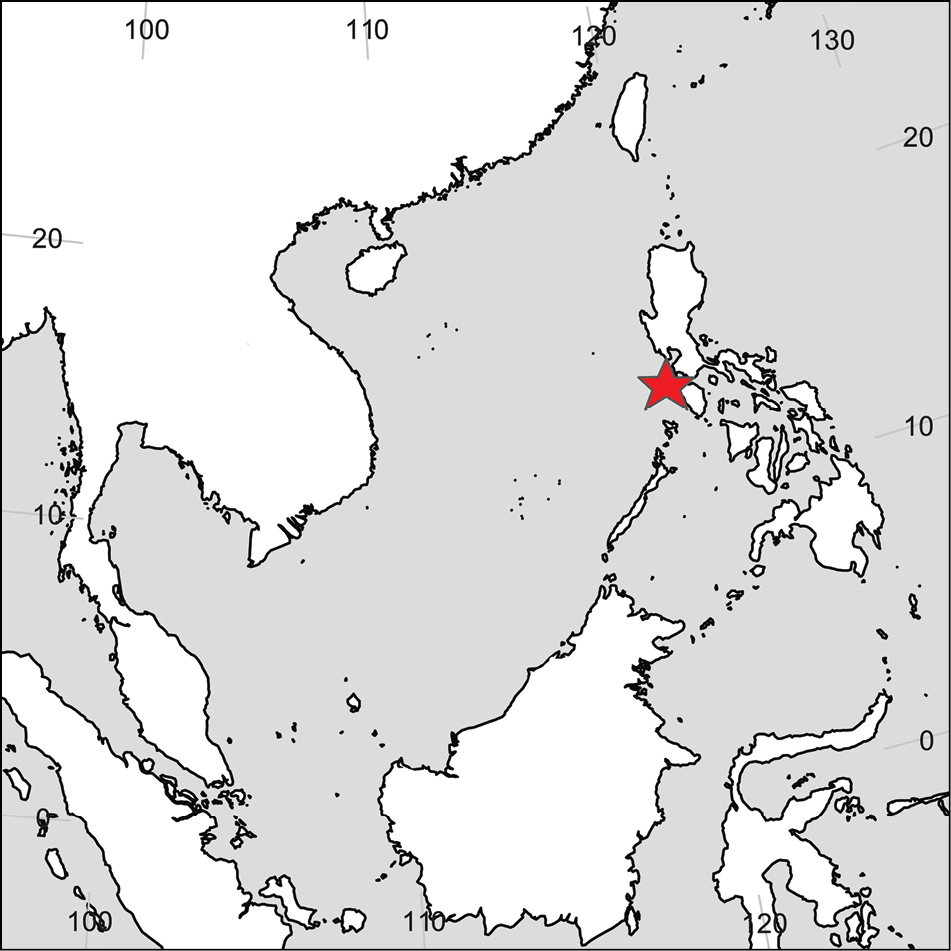
Figure 2.Distribution of Aroui hamatopodus Lowry & Stoddart, 1989. Star indicates type locality.
-
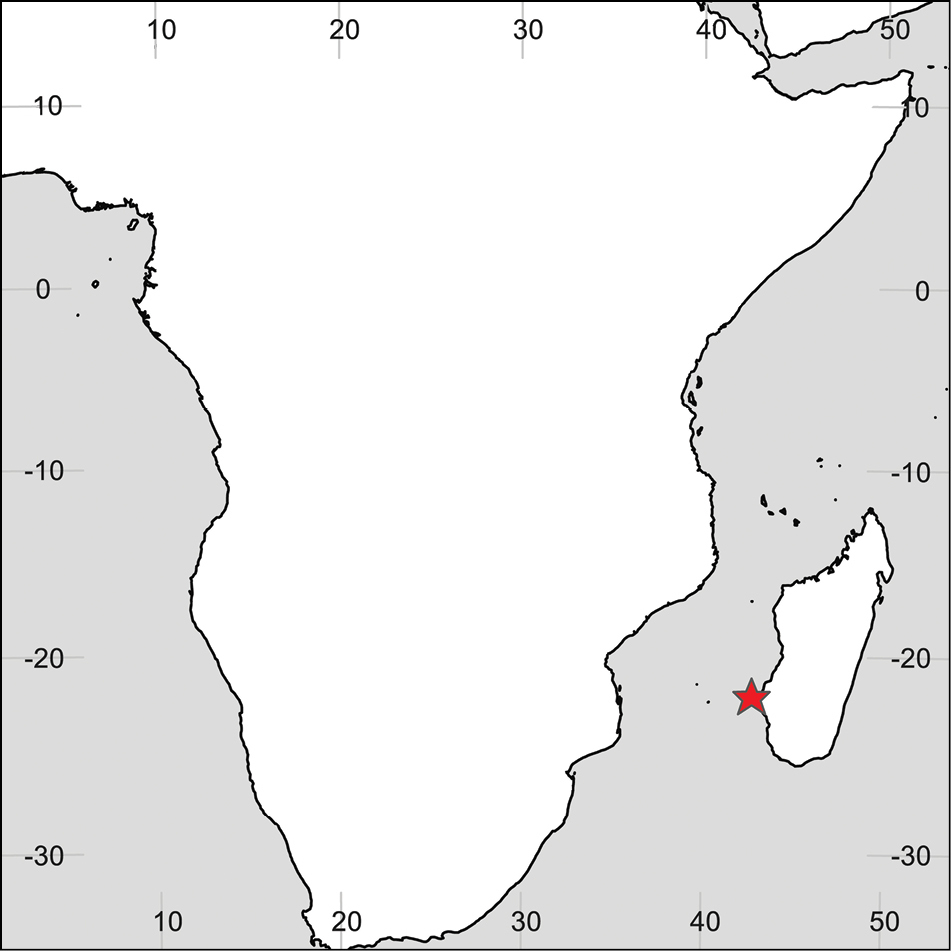
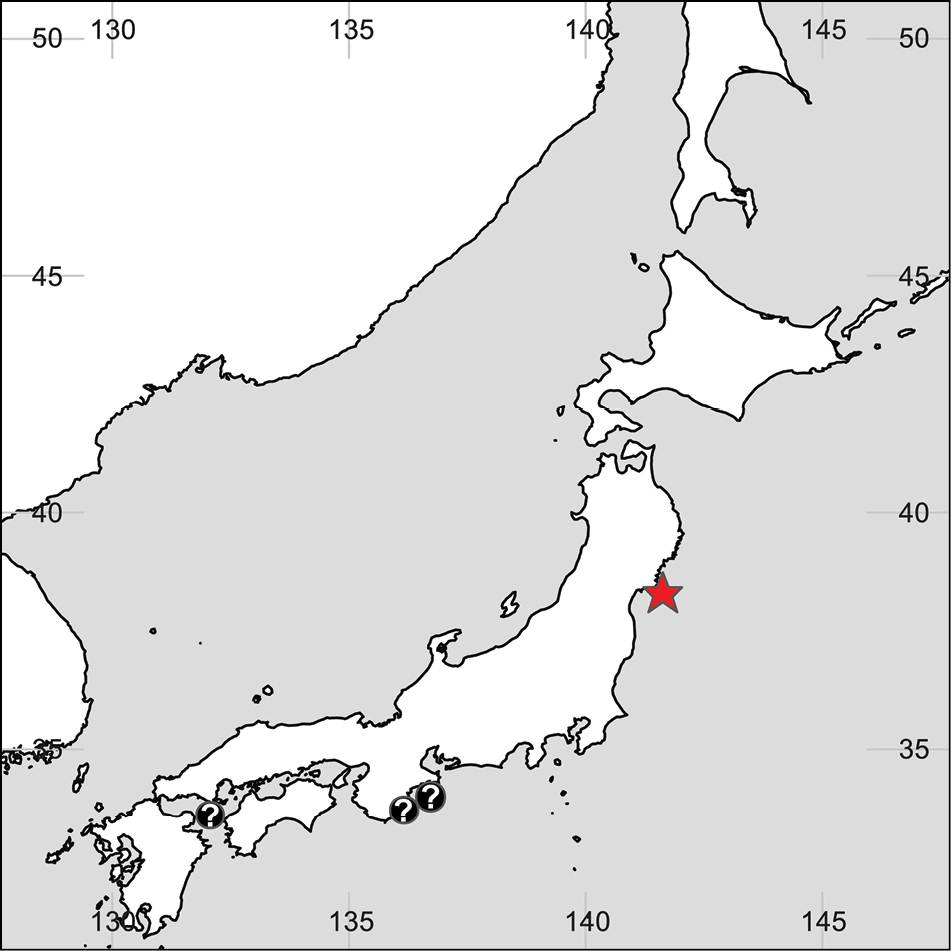
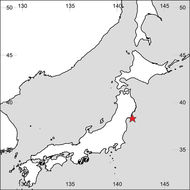
Figure 3.Distribution of Aroui onagawae (Takekawa & Ishimaru, 2000). Star indicates type locality, question marks indicates uncertain records.
-
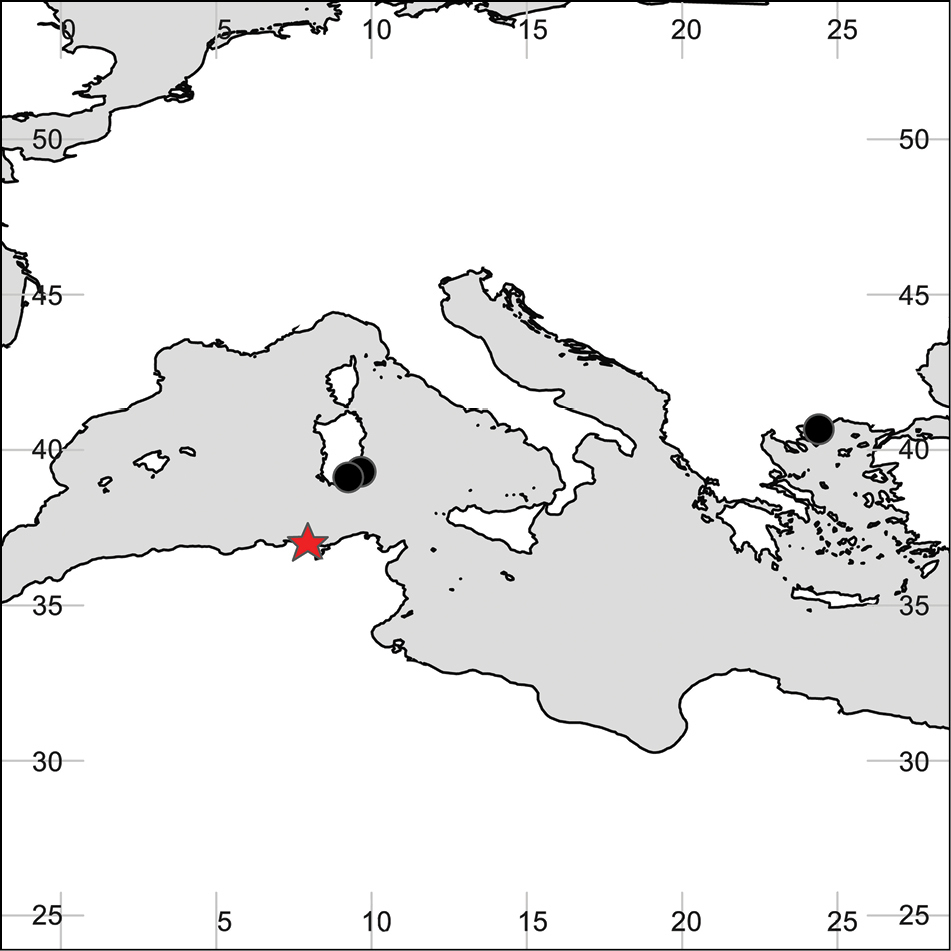
Figure 4.Distribution of Aroui setosus Chevreux, 1911. Star indicates type locality.
-
Figure 5.Aroui setosus Chevreux, 1911. Lectotype female, 8.0 mm, MNHN-Am3985, off Bône, Mediterranean Sea. Scales represent 0.1 mm.
-
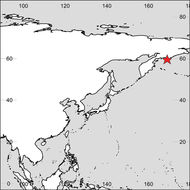
Figure 6.Distribution of Paracallisomopsis beljaevi Gurjanova, 1962.
-
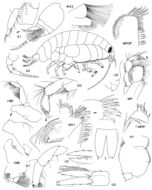
Figure 7.Paracallisomopsis beljaevi Gurjanova. Syntype, sex not known, 5.5 mm, AM P.35701, Barents Sea. Scales for gnathopods, pereopods represent 0.2 mm; remainder represents 0.1 mm.
-
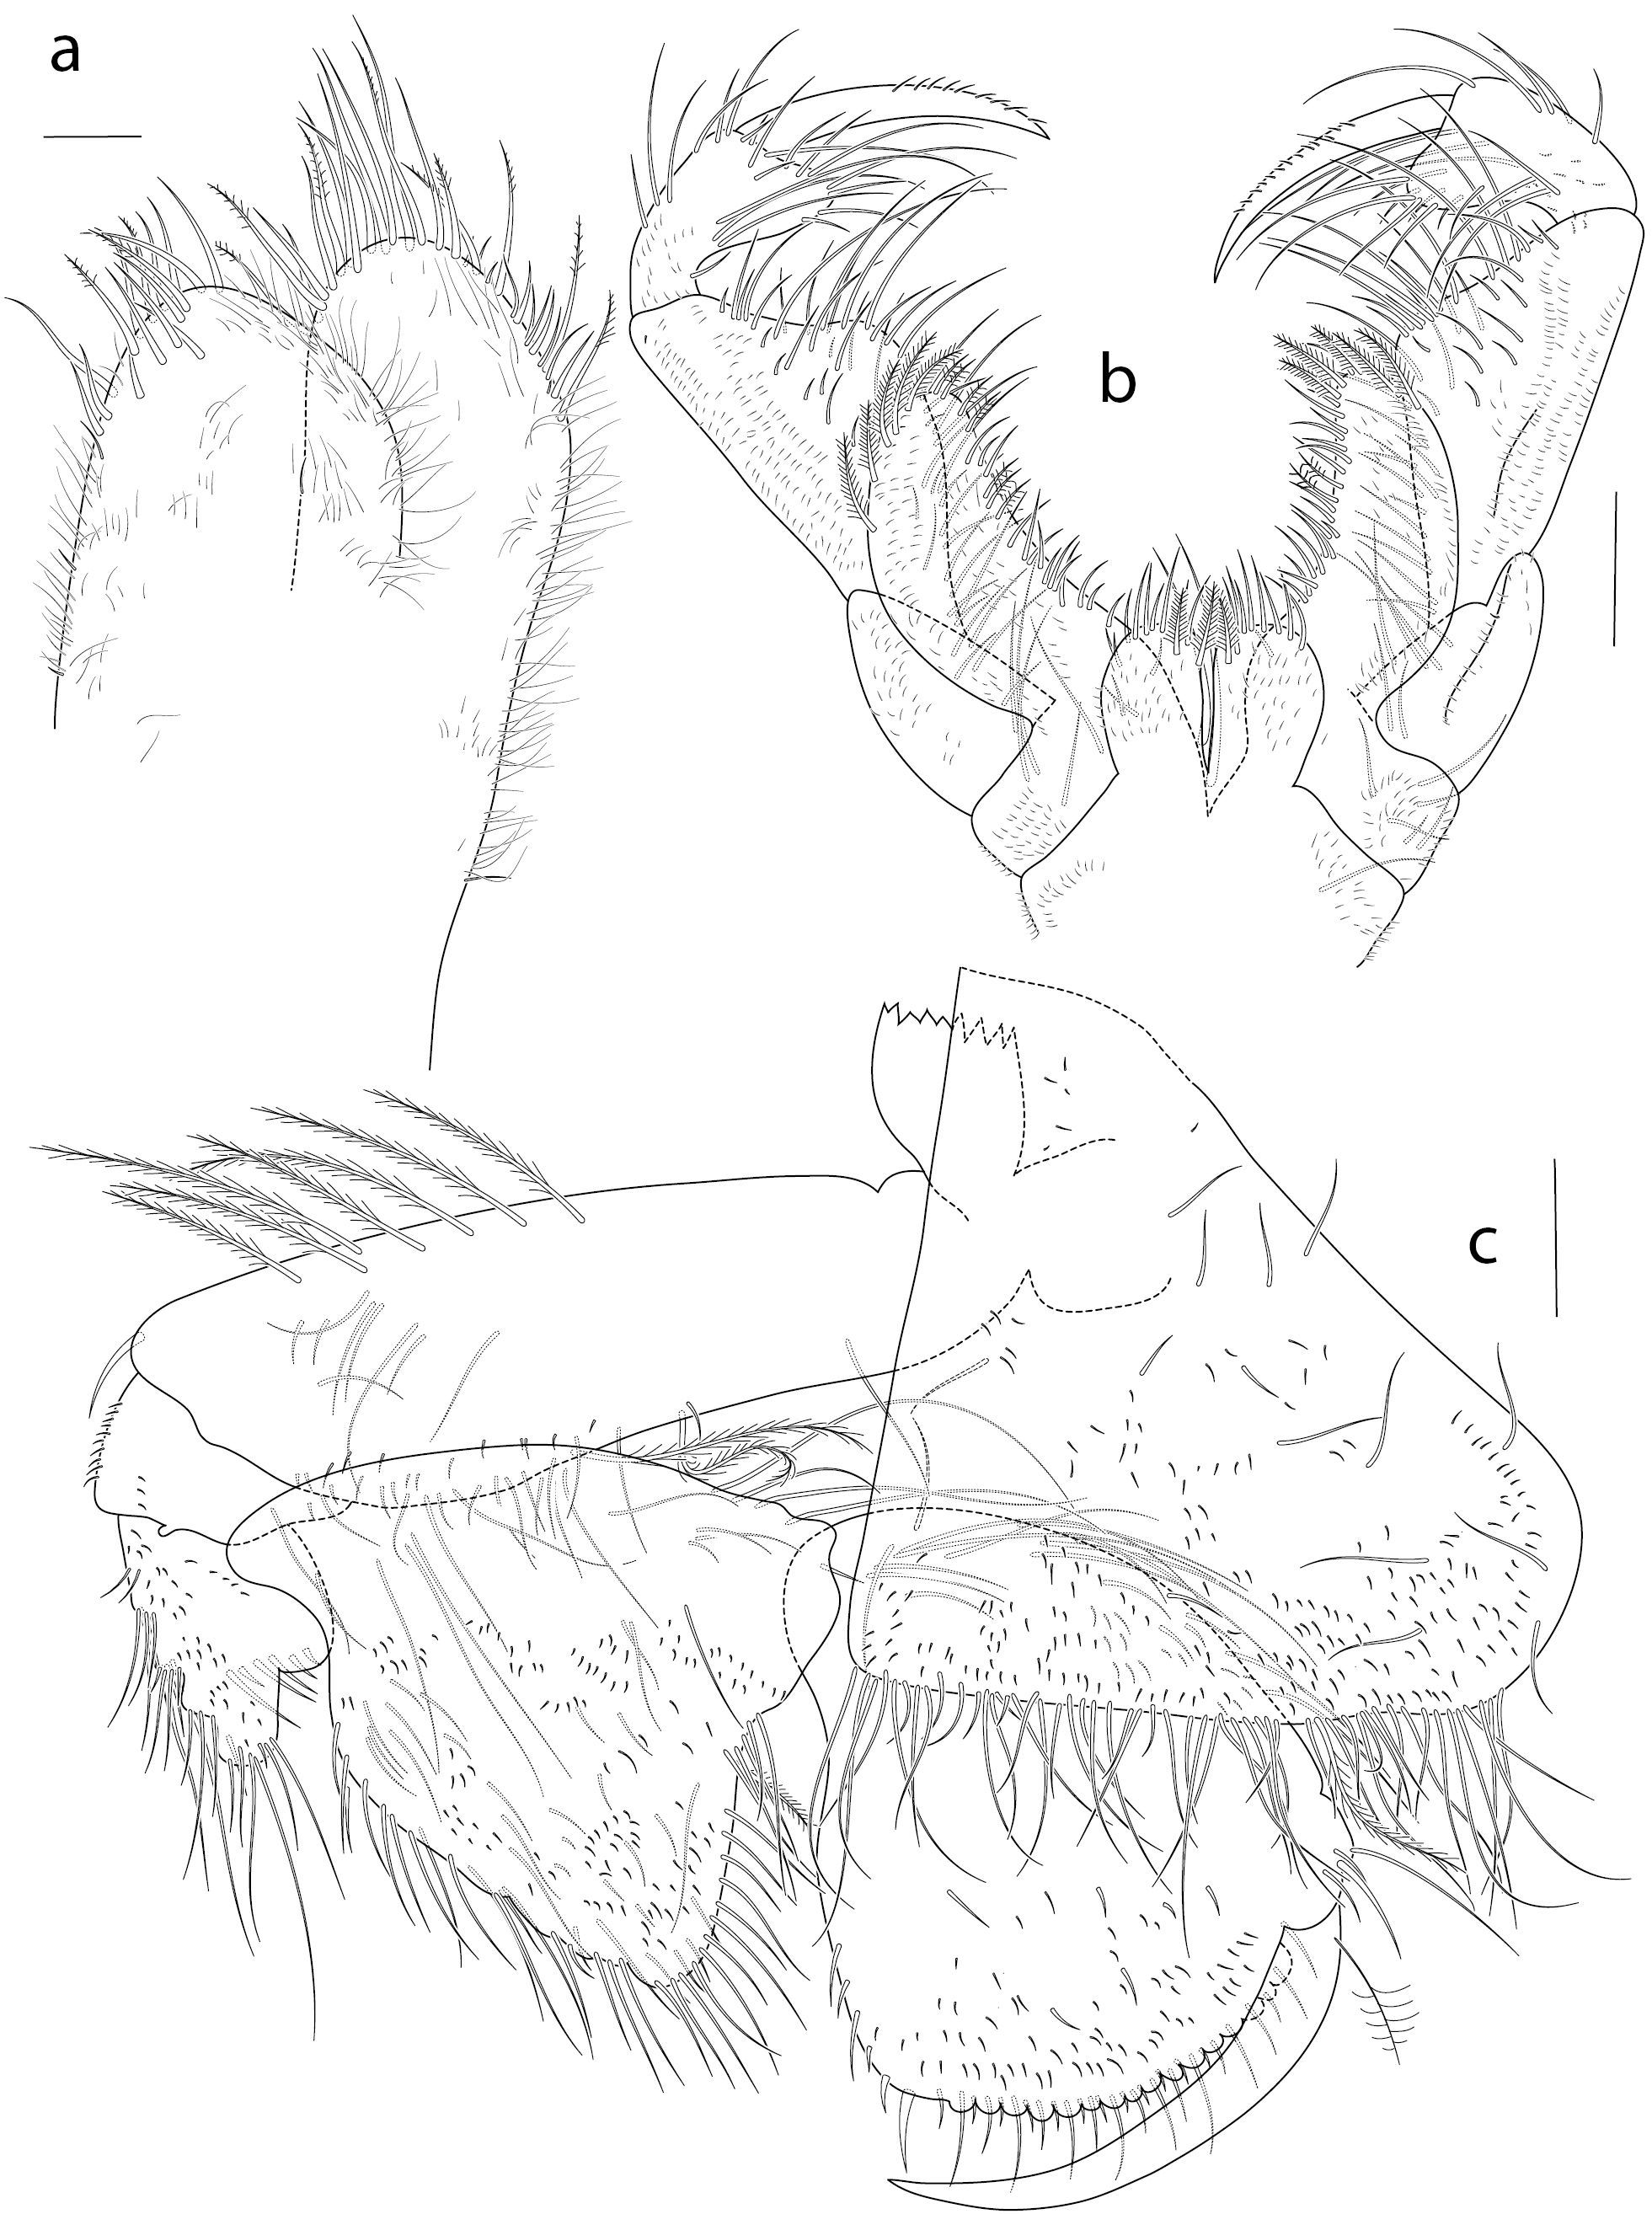
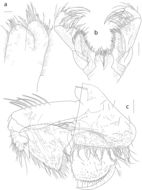
Figure 2.Oedicerina ingolfi, ovig. female, 10.3 mm; Norwegian Sea, ZMBN 95143, St. 81.08.14.5. a) maxilla 2; b) maxillipeds; c) gnathopod 1. Scale bars: a; 100 µm: b, c; 200 µm.