Lajin Capnobotes tunnetut esiintymiset, kerätyt näytteet ja havainnot. Näytä lajin profiili GBIF:ssä
Epäinteraktiiviset kartat
-
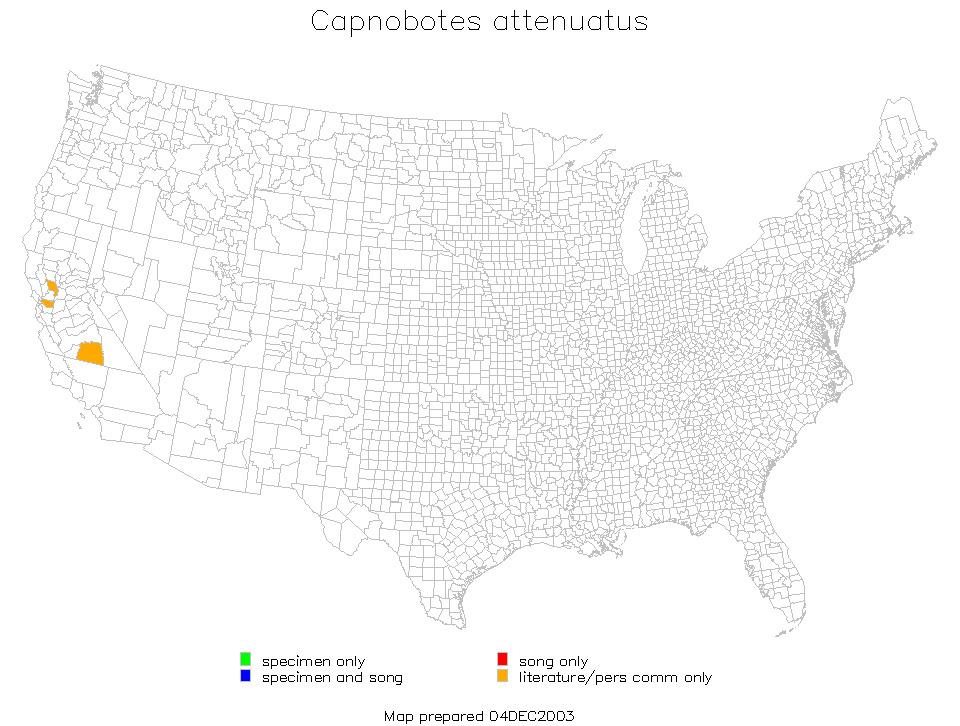
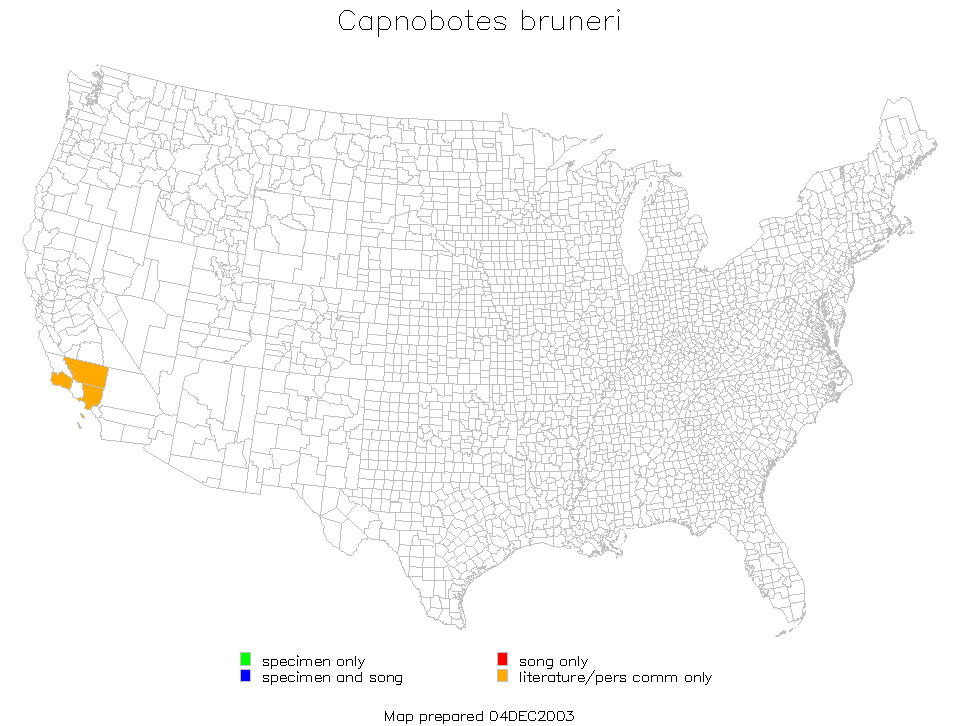
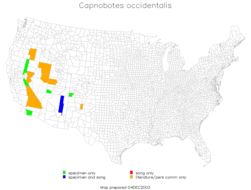
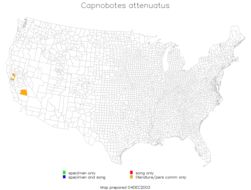
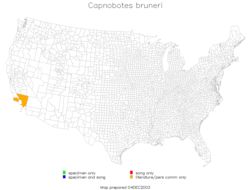
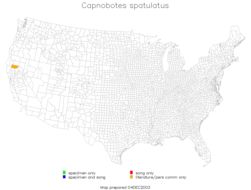
Version of computer-generated U.S. distribution map displayed above was harvested from SINA on Aug-05-2018.See also this
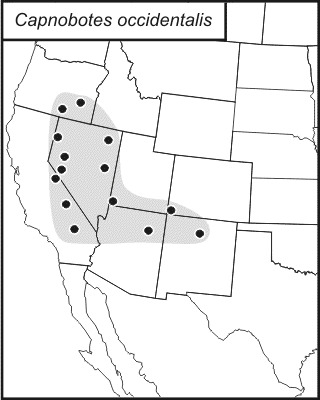
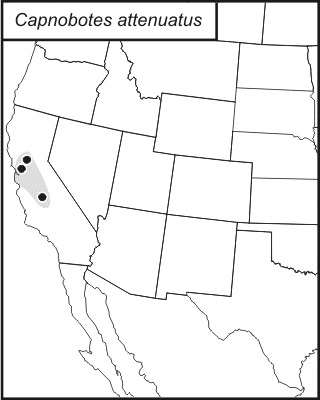
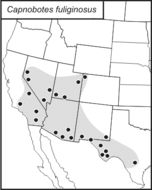
manually generated dot map showing U.S. and Canadian records, with shaded area showing likely general distribution.
-
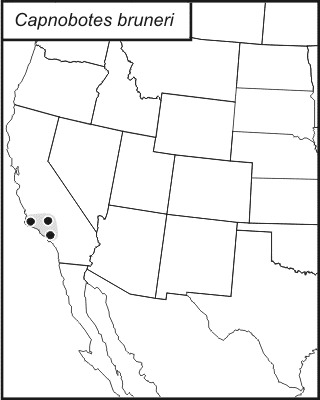
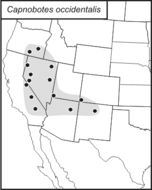
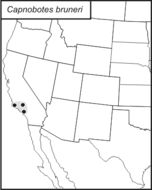
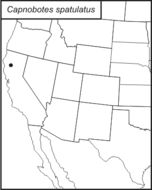
Version of manually-generated dot map displayed above, showing U.S. and Canadian records, was harvested from SINA on Aug-05-2018.Dots show county records; shaded area shows general likely distribution.
See also this computer-generated U.S. distribution map, produced in 2003 from records in a
database available on the Singing Insects of North America site.
-
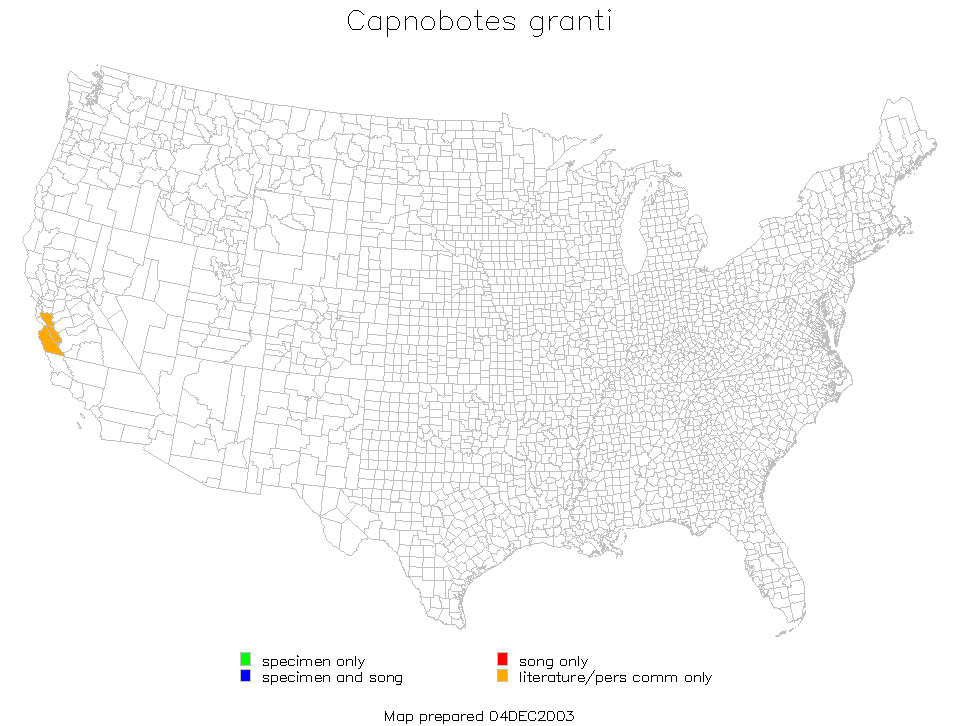
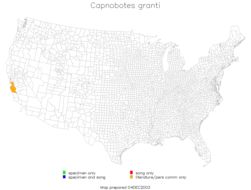
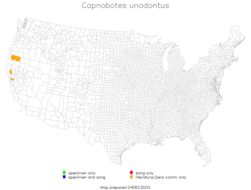
Version of computer-generated U.S. distribution map displayed above was harvested from SINA on Aug-05-2018.See also this
manually generated dot map showing U.S. and Canadian records, with shaded area showing likely general distribution.
-
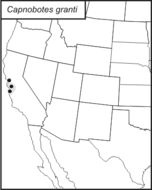
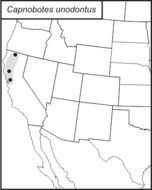
Version of manually-generated dot map displayed above, showing U.S. and Canadian records, was harvested from SINA on Aug-05-2018.Dots show county records; shading shows likely general distribution.
See also this computer-generated U.S. distribution map, produced in 2003 from records in a
database available on the Singing Insects of North America site.
-
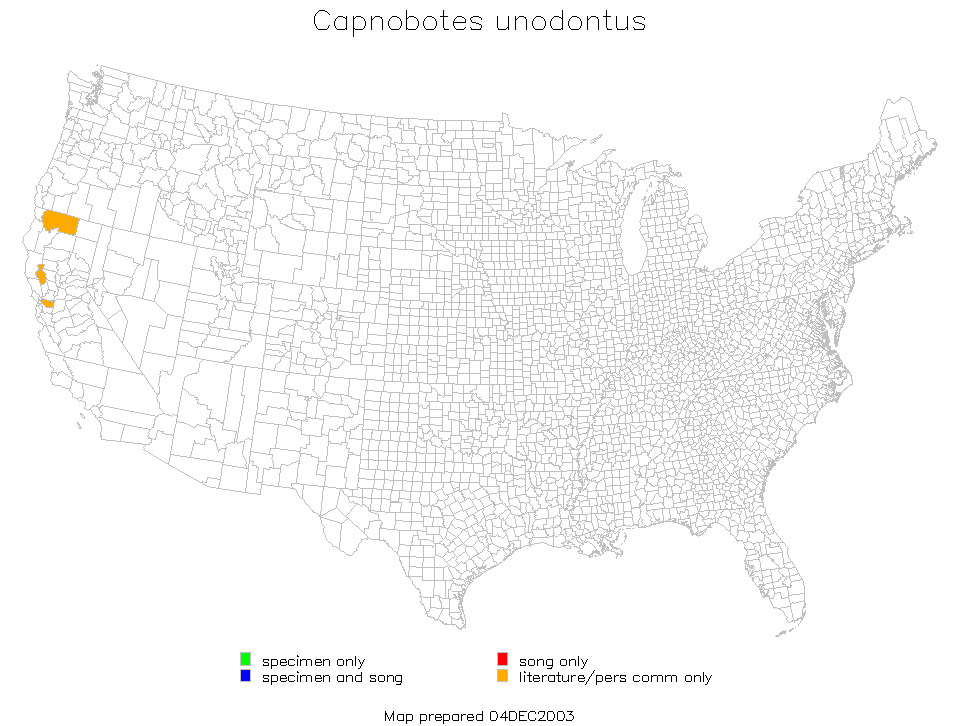
Version of computer-generated U.S. distribution map displayed above was harvested from SINA on Aug-05-2018.See also this
manually generated dot map showing U.S. and Canadian records, with shaded area showing likely general distribution.
-
Version of manually-generated dot map displayed above, showing U.S. and Canadian records, was harvested from SINA on Aug-05-2018.Dots show county records; shading shows likely general distribution.
See also this computer-generated U.S. distribution map, produced in 2003 from records in a
database available on the Singing Insects of North America site.
-
Version of computer-generated U.S. distribution map displayed above was harvested from SINA on Aug-05-2018.See also this
manually generated dot map showing U.S. and Canadian records, with shaded area showing likely general distribution.
-
-
Version of computer-generated U.S. distribution map displayed above was harvested from SINA on Aug-05-2018.See also this
manually generated dot map showing U.S. and Canadian records, with shaded area showing likely general distribution.
-
Version of manually-generated dot map displayed above, showing U.S. and Canadian records, was harvested from SINA on Aug-05-2018.Dots show county records; shading shows likely general distribution.
See also this computer-generated U.S. distribution map, produced in 2003 from records in a
database available on the Singing Insects of North America site.


